. 2010 Apr 15;518(8):1370-90.
doi: 10.1002/cne.22282.

Regional heterogeneity in astrocyte responses following contusive spinal cord injury in mice

Affiliations

Regional heterogeneity in astrocyte responses following contusive spinal cord injury in mice

Robin E White et al. J Comp Neurol. .

Abstract

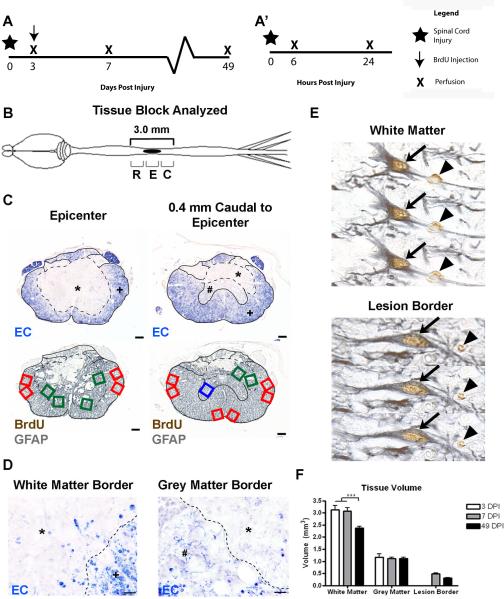
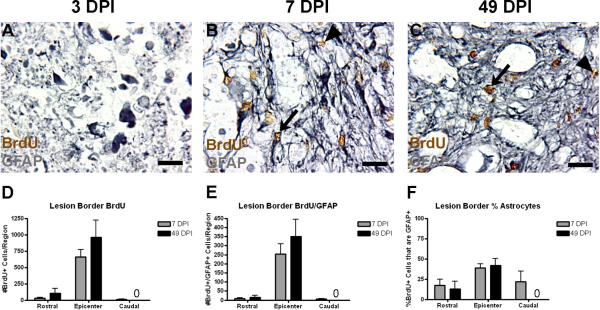
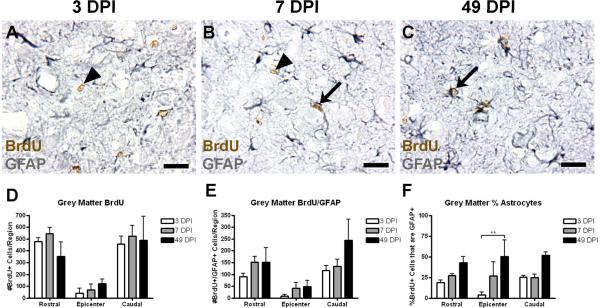
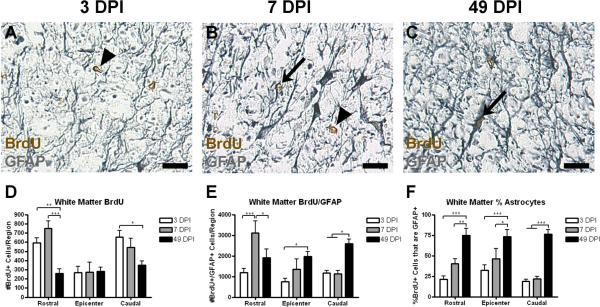
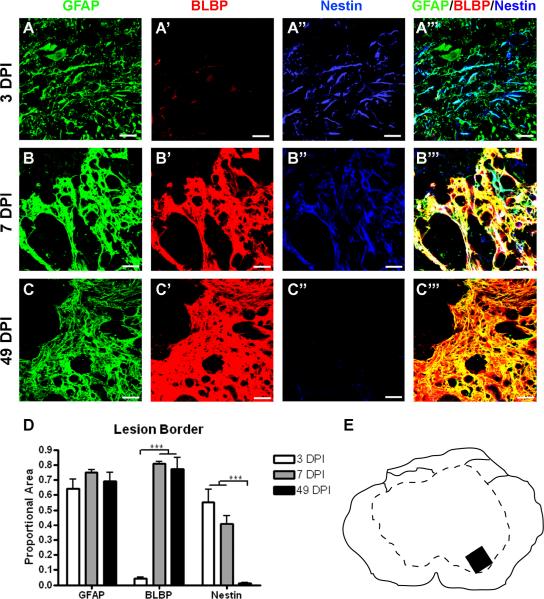
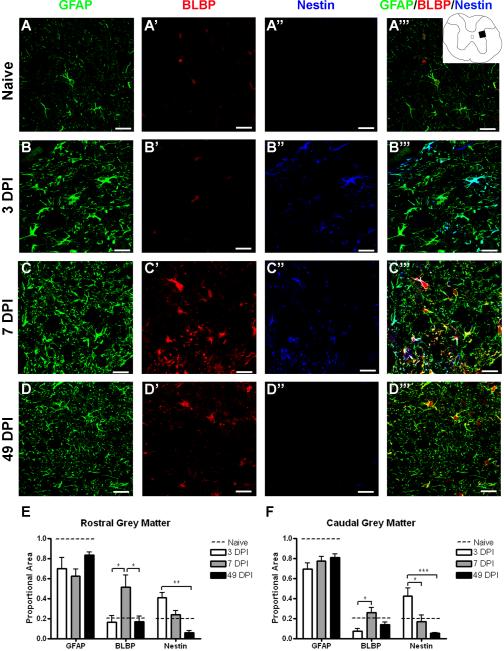
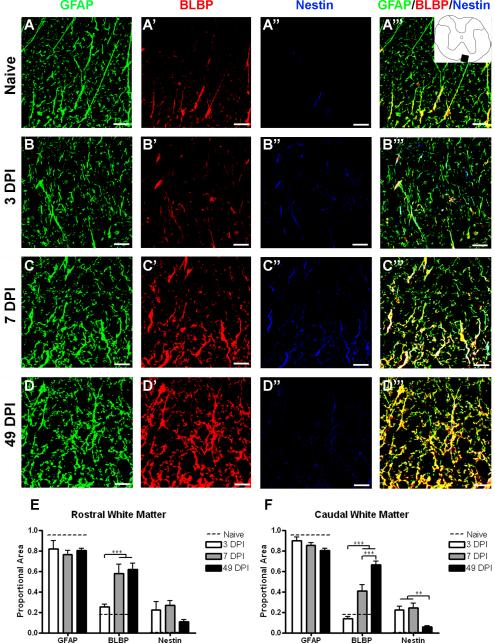
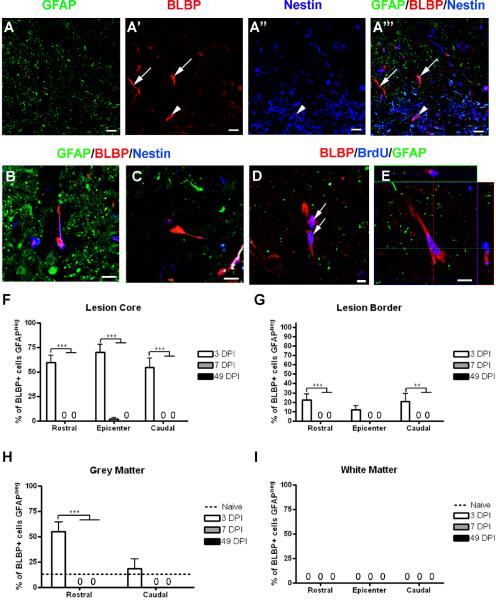
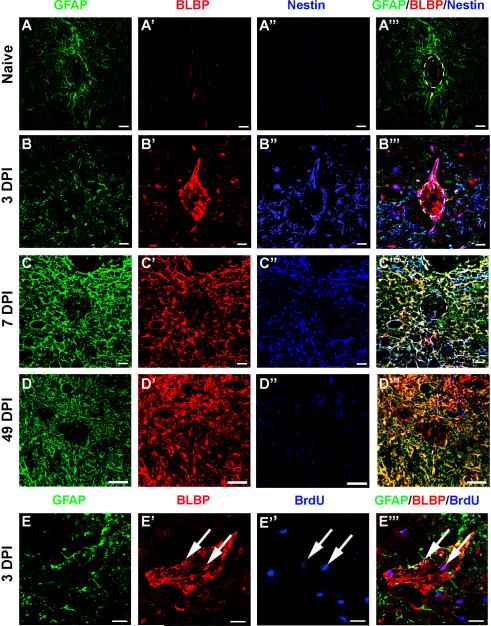
Astrocytes and their precursors respond to spinal cord injury (SCI) by proliferating, migrating, and altering phenotype. This contributes to glial scar formation at the lesion border and gliosis in spared gray and white matter. The present study was undertaken to evaluate astrocyte changes over time and determine when and where interventions might be targeted to alter the astrocyte response. Bromodeoxyuridine (BrdU) was administered to mice 3 days after SCI, and cells expressing BrdU and the astrocyte marker, glial fibrillary acidic protein (GFAP), were counted at 3, 7, and 49 days post-injury (DPI). BrdU-labeled cells accumulated at the lesion border by 7 DPI and approximately half of these expressed GFAP. In spared white matter, the total number of BrdU+ cells decreased, while the percentage of BrdU+ cells expressing GFAP increased at 49 DPI. Phenotypic changes were examined using the progenitor marker nestin, the radial glial marker, brain lipid binding protein (BLBP), and GFAP. Nestin was upregulated by 3 DPI and declined between 7 and 49 DPI in all regions, and GFAP increased and remained above naïve levels at all timepoints. BLBP increased early and remained high along the lesion border and spared white matter, but was expressed transiently by cells lining the central canal and in a unique population of small cells found within the lesion and in gray matter rostral and caudal to the border. The results demonstrate that the astrocyte response to SCI is regionally heterogeneous, and suggests astrocyte populations that could be targeted by interventions.


Figures

Figure 1
Figure 1
BrdU+ and BrdU+/GFAP+ cell counting paradigm. (A) Time course of the two experiments as described in the methods, showing the BrdU administration paradigm used for BrdU+/GFAP+ cell counting (A) and acute marker expression analysis (A'). (B) Schematic drawing of the CNS with a midthoracic SCI, indicated by the solid black oval. Sections were examined at 200 μm intervals from 1.4 mm rostral to 1.4 mm caudal from the lesion epicenter, and these regions were further divided into Rostral-R, Epicenter-E, and Caudal-C levels for quantitative analyses. (C) Examples of 2 pairs of transverse spinal cord sections are shown from the epicenter (left) and 0.4 mm caudal to the epicenter (right). EC staining was used to identify the distribution of the lesion edge (dashed line) and spared grey matter and spared white matter. Sample fields were counted in adjacent tissue sections stained with BrdU and GFAP antisera. Green boxes indicate lesion border areas, red boxes indicate spared white matter, and blue boxes indicate spared grey matter. * indicates the lesion, # depicts spared grey matter, and + is spared white matter. (D) High-magnification images of white matter (left) and grey matter (right) borders, with the lesion border depicted by a dashed line. (E) Examples of double-labeled BrdU+/GFAP+ cells in spared white matter (top) and lesion border (bottom), through three planes of focus. Single labeled BrdU+ cells are identified by an arrowhead, while double labeled cells are indicated by an arrow. (F) Quantification of changes in total tissue volume in different regions over time. Scale = 100 μm (C), 10 μm (D).
Figure 2
Figure 2
Early proliferating cells accumulate at the lesion border by 7 DPI. (A–C) Representative images of lesion border regions at the injury epicenter at 3 (A), 7 (B), and 49 DPI. Examples of single and double-labeled cells are indicated by arrowheads and arrows, respectively. (D–F) Quantification of the number of BrdU+ cells (D), number of BrdU+/GFAP+ cells (E), and the percentage of BrdU+ cells also expressing GFAP (F) at 7 and 49 DPI. Cell counts were not performed for this region at 3 DPI because the region is not yet defined. “0” in graphs designate no cells in the indicated regions. Scale = 10 μm.
Figure 3
Figure 3
The number of BrdU+ and BrdU+/GFAP+ cells is unchanged in spared grey matter after SCI. (A–C) Representative images of spared grey matter 1.0 mm caudal from the injury epicenter at 3 (A), 7 (B), and 49 DPI (C). Examples of single and double labeled cells are indicated with arrowheads and arrows, respectively. (D–F) Quantification of the number of BrdU+ cells (D), number of BrdU+/GFAP+ cells (E), and the percentage of BrdU+ cells also expressing GFAP (F) in spared grey matter at 3, 7, and 49 DPI. Scale = 10 μm. **p < 0.01 (% of astrocytes in the epicenter region at 3 vs. 39 DPI).
Figure 4
Figure 4
In spared white matter, the number of BrdU+ cells decreases over time while the number of and percentage of BrdU+/GFAP+ cells increases. (A–C) Representative images of spared grey matter 1.0 mm caudal from the injury epicenter at 3 (A), 7 (B), and 49 DPI (C), with examples of single and double-labeled cells indicated with arrowheads and arrows, respectively. (D–F) Quantification of the number of BrdU+ cells (D), number of BrdU+/GFAP+ cells (E), and the percentage of BrdU+ cells also expressing GFAP (F) in spared white matter. Scale = 10 μm. *p < 0.05 (BrdU+ cells in the caudal region 3 vs. 49 DPI; BrdU+/GFAP+ cells in the rostral region 7 vs. 49 DPI; BrdU+/GFAP+ cells in the epicenter region 3 vs. 49 DPI; BrdU+/GFAP+ cells in the caudal region 3 and 7 vs. 49 DPI; % astrocytes in the epicenter region 7 vs. 49 DPI), **p < 0.01 (BrdU+ cells in the rostral region 3 vs. 49 DPI; % astrocytes in the rostral region 7 vs. 49 DPI), ***p < 0.001 (BrdU+ cells in the rostral region 7 vs. 49 DPI; BrdU+/GFAP+ cells in the rostral region 3 vs. 7 DPI; % astrocytes in all regions 3 vs. 49 DPI).
Figure 5
Figure 5
Nestin expression increases transiently after injury in the lesion border, while BLBP levels rise later and stay high chronically. (A–C) Representative confocal images of GFAP (green), BLBP (red), and nestin (blue) expression and merged images of three markers (right) at 3 DPI (A–A'''), 7 DPI (B–B''') and 49 DPI (C–C'''). (D) Quantification of the proportion of merged staining area represented by GFAP, BLBP, and nestin expression levels over time. Scale = 20 μm. (E) Schematic depicting region shown in confocal images. ***p < 0.001 (BLBP 3 vs. 7 and 49 DPI; nestin 3 and 7 vs. 49 DPI).
Figure 6
Figure 6
BLBP and nestin expression transiently increase in spared grey matter. (A–D) Confocal images of GFAP (green), BLBP (red), and nestin (blue) in naïve tissue (A–A''') and 1.0 mm caudal from the lesion epicenter at 3 (B–B'''), 7 (C–C''') and 49 (D–D''') DPI. Inset depicts region shown in confocal images. (E–F) Quantification of the proportion of merged staining area represented by GFAP, BLBP, and nestin immunoreactivity over time both rostral (E) and caudal (F) to the injury epicenter. The dashed line in each graph depicts the proportion of merged staining colocalized with each of the markers in naïve tissue specimens. Scale = 20 μm. *p < 0.05 (BLBP rostral 3 vs. 7 vs. 49 DPI; BLBP caudal 3 vs. 7 DPI; nestin caudal 3 vs. 7 DPI), **p < 0.01 (nestin rostral 3 vs. 49 DPI), ***p < 0.001 (nestin caudal 3 vs. 49 DPI).
Figure 7
Figure 7
BLBP expression is chronically upregulated in spared white matter, while nestin expression only transiently increases. (A–D) Confocal images of GFAP (green), BLBP (red), and nestin (blue) in naïve tissue (A–A''') and 1.0 mm caudal from the lesion epicenter at 3 (B–B'''), 7 (C–C''') and 49 (D–D''') DPI. Inset depicts region shown in confocal images. (E–F) Quantification of the proportion of merged staining area represented by GFAP, BLBP, and nestin immunoreactivity over time both rostral (E) and caudal (F) to the injury epicenter. The dotted line in each graph depicts the proportion of merged staining colocalized with each of the markers in naïve tissue specimens. Scale = 20 μm. **p < 0.01 (nestin caudal 3 and 7 vs. 49 DPI), ***p < 0.001 (BLBP rostral 3 vs. 7 and 49 DPI; BLBP caudal 3 vs. 7 and 49 DPI; BLBP caudal 7 vs. 49 DPI).
Figure 8
Figure 8
BLBP+/GFAPneg cells are present early after injury and exhibit a unique morphology. (A–A''') Confocal images of GFAP (green), BLBP (red), and nestin (blue) showing examples of BLBP+/GFAPneg cells that do (arrowhead in A''', B) and do not (arrows in A''', C) express nestin. (D) Confocal image showing examples of BLBP+/GFAPneg cells expressing BrdU (blue). (E) Confocal z-stack confirming double-labeling of BLBP and BrdU. (F–I) Quantification of the percentage of BLBP+ cells from the lesion core (F), lesion border (G), spared grey matter (H), and spared white matter (I) that did not express GFAP. Scale = 20 μm (A–A'''), 5 μm (B–E). **p < 0.01 (lesion border caudal 3 vs. 49 DPI), ***p < 0.001 (lesion core all regions 3 vs. 7 and 49 DPI; grey matter rostral 3 vs. 7 and 49 DPI).
Figure 9
Figure 9
BLBP expression is transiently increased in cells lining the central canal early after injury. (A–D) Confocal images showing GFAP (green), BLBP (red), and nestin (blue) expression in the naïve central canal at spinal level T9 (A–A''') and in the central canal region caudal to the epicenter at 3 DPI (B–B'''), 7 DPI (C–C'''), and 49 DPI (D–D'''). (E) Example of a BrdU+ cells (blue) colabeled with BLBP (red) in the central canal at 3 DPI (arrows). Scale = 20 μm.

Similar articles

Cited by

References

    1. Abe Y, Yamamoto T, Sugiyama Y, Watanabe T, Saito N, Kayama H, Kumagai T. Apoptotic cells associated with Wallerian degeneration after experimental spinal cord injury: A possible mechanism of oligodendoglial death. J Neurotrauma. 1999;16:945–952. - PubMed
    1. Anthony TE, Mason HA, Gridley T, Fishell G, Heintz N. Brain lipid-binding protein is a direct target of Notch signaling in radial glial cells. Genes Dev. 2005;19:1028–1033. - PMC - PubMed
    1. Barry D, McDermott K. Differentiation of radial glia from radial precursor cells and transformation into astrocytes in the developing rat spinal cord. GLIA. 2005;50:187–197. - PubMed
    1. Basso DM, Beattie MS, Bresnahan JC. Graded histological and locomotor outcomes after spinal cord contusion using the NYU weight-drop device versus transection. Exp Neurol. 1996;139:244–256. - PubMed
    1. Beck T, Lutz B, Theole U, Wree A. Assessing chronic brain damage by quantification of regional volumes in postischemic rat brains. Brain Res. 1993;605:280–286. - PubMed

Publication types

MeSH terms