. 2010 Mar 11;114(9):3276-84.
doi: 10.1021/jp908730t.

Adsorption of egg phosphatidylcholine to an air/water and triolein/water bubble interface: use of the 2-dimensional phase rule to estimate the surface composition of a phospholipid/triolein/water surface as a function of surface pressure

Affiliations

Adsorption of egg phosphatidylcholine to an air/water and triolein/water bubble interface: use of the 2-dimensional phase rule to estimate the surface composition of a phospholipid/triolein/water surface as a function of surface pressure

Matthew A Mitsche et al. J Phys Chem B. .

Abstract

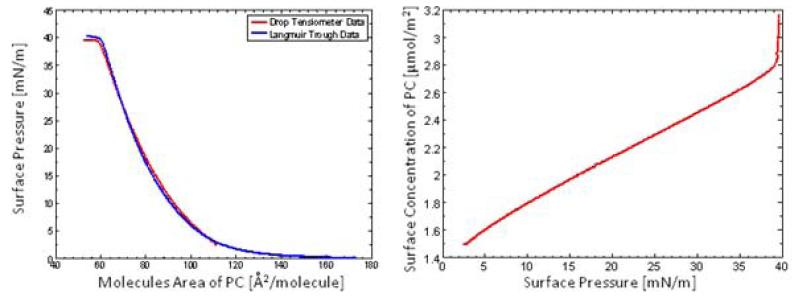
Phospholipid monolayers play a critical role in the structure and stabilization of biological interfaces, including all membranes, the alveoli of the lungs, fat droplets in adipose tissue, and lipoproteins. The behavior of phospholipids in bilayers and at an air-water interface is well understood. However, the study of phospholipids at oil-water interfaces is limited due to technical challenges. In this study, egg phosphatidylcholine (EPC) was deposited from small unilamellar vesicles onto a bubble of either air or triolein (TO) formed in a low-salt buffer. The surface tension (gamma) was measured using a drop tensiometer. We observed that EPC binds irreversibly to both interfaces and at equilibrium exerts approximately 12 and 15 mN/m of pressure (Pi) at an air and TO interface, respectively. After EPC was bound to the interface, the unbound EPC was washed out of the cuvette, and the surface was compressed to study the Pi/area relationship. To determine the surface concentration (Gamma), which cannot be measured directly, compression isotherms from a Langmuir trough and drop tensiometer were compared. The air-water interfaces had identical characteristics using both techniques; thus, Gamma on the bubble can be determined by overlaying the two isotherms. Both TO and EPC are surface-active, so in a mixed TO/EPC monolayer, both molecules will be exposed to water. Since TO is less surface-active than EPC, as Pi increases, the TO is progressively ejected. To understand the Pi/area isotherm of EPC on a TO bubble, a variety of TO-EPC mixtures were spread at the air-water interface. The isotherms show an abrupt break in the curve caused by the ejection of TO from the monolayer into a new bulk phase. By overlaying the compression isotherm above the ejection point with a TO bubble compression isotherm, Gamma can be estimated. This allows determination of Gamma of EPC on a TO bubble as a function of Pi.


Figures

Figure 1
Figure 1
Diagram of a drop tensiometer shows the basic features of the apparatus. A) The bubble outline is illuminated by a light source (1). The bubble is made at the tip of a J-tube connected to a syringe filled with oil or air (2). This is submerged in a thermostated cuvette filled with 2 mM sodium phosphate buffer (3, see Figure 1B for more details). The volume of the bubble can is adjusted by a motor attached to the syringe which automatically makes changes in the volume >0.02 μL (2). The profile of the bubble is collected by a high speed CCD camera (4) which outputs to a computer that reports the surface tension (γ) according the Laplace equation adapted for a bubble (5). B) An enlarged image of the thermostated cuvette shows important details. The cuvette is filled with buffer and is stirred by a magnetic stir bar (1). The volume of the bubble is controlled by a motor attached to the syringe (2) which can make small, fast, or calibrated slower changes to the volume of the bubble (3). To exchange the buffer a tube attached to a reservoir of lipid free buffer was placed near the bottom of the cuvette (4) and a tube attached to a vacuum was placed directly on the surface of the water to remove buffer as the buffer level rose (5). C) The bubble profile is analyzed according to the Laplace equation adapted for a bubble ,. The x-and z-axis are the Cartesian coordinates. Θ is the angle between the tangent to the bubble and the x-axis, and b is the radius of curvature at the point of the tangent. This figure was adapted from Labourdenne et. al. and Benjamins et. al. .
Figure 2
Figure 2
Compression isotherms of EPC (A) and TO (B) monolayers spread on a Langmuir trough. EPC showed a collapse point at an area per molecule of 58 ± 3 Å2/molecule and a Π of 38.9 ± 0.8 mN/m (mean and standard deviation; N=9). Π deviates from 0 at an approximate area per molecule of 140 Å2 and the extrapolated deviation from Π=0 is 90 Å2/molecule. The surface was compressed at a rate of 3.75 cm2/min. The isotherm was reversible when reexpanded from 37 mN/m but when it was reexpanded beyond Π=40 mN/m it was irreversible. Compression isotherm of TO spread on a Langmuir trough showed a break in the curve at a pressure of 12.1 mN/m (at 23°C and a compression rate of 3.75 cm2/minute). At an area smaller than 90 Å2/molecule and Π greater than 12.1 mN/m some of the TO is expelled from the monolayer and forms a new bulk phase which is in equilibrium with the TO monolayer at its minimum area (~90 Å2/molecule).
Figure 3
Figure 3
Drop tensiometer experiment of EPC binding to an air-water interface showing the relationship between γ (top) and bubble surface area (bottom) verse time. A) At time point zero a bubble was created in a suspension of EPC SUVs at a concentration of 0.17 mg/mL. During the adsorption there is a short time lag, a rapid adsorption phase, and finally approached an equilibrium value of 52 ± 1.7 mN/m. B)After equilibrium γ was approached the lipid was removed from the surrounding suspension by flowing 250 mL of lipid free buffer through the cuvette from the time period 12,610 to 13,140 seconds (bold line). After the buffer exchange γ remained constant. Then the bubble volume was slowly changed at a constant rate of ±0.02 μL/sec to vary the bubble area and generate data to construct a Π/A curve (see Figure 4).
Figure 4
Figure 4
Π/area isotherm of an EPC monolayer at an A/W interface using a bubble tensiometer. When the bubble is compressed (1) and reexpanded (2) to Π=27 mN/m the reexpansion is reversible and follows the same isotherm as the initial compression. The compressions were done at a rate of 0.02 μL/sec, corresponding to a change of ~4.1 mm2/min. When the bubble is recompressed (3) to a Π greater than 39 ± 1.3 (n=9) mN/m the slope of the curve becomes dramatically smaller, indicating the collapse point. When the surface is reexpanded after the collapse it follows a different isotherm than before the collapse (4). When the surface is recompressed it follows the post collapse reexpansion isotherm. Because the amount of phospholipid that binds to the surface is unknown the area per molecule cannot be directly calculated.
Figure 5
Figure 5
An example of Π/area compression isotherms of EPC/triolein (TO) mixtures (1-5) and pure EPC (6) spread on a Langmuir trough at an A/W interface, expressed as area per EPC molecule. The mixture that was initially spread contained a TO:EPC ratio of 3.5:1 (1), 2:1 (2), 1:1 (3), 0.5:1 (4), 0.2:1 (5) and pure EPC (6, equivalent to Figure 2). Mixed TO-EPC monolayers (1-5) show 2 distinct changes in the slope of the compression isotherms: one at Π=~45mN/m and area of 100 Å2/molecule while the other, called the envelope point, occurs at varying Π and area depending on the ratio of TO:EPC added. The collapse Π for the pure TO monolayer is 12.1 mN/m and is shown as a dotted line. All experiments happened at a temperature of 22.8 ±0.6 °C. Below the envelope points (marked by arrows) Π is independent of the area per EPC molecule. Above the envelope Π all 5 isotherms align. The envelope Π in all cases is higher than the collapse Π of a pure TO monolayer (12.1 mN/m, indicated by the dotted line). The collapse Π and area of mixed monolayers of TO:EPC are both higher than the collapse Π and area of a pure EPC monolayer (6). Each molar ratio was repeated at least 3 times yielding similar results. Inset) The derived surface phase diagram of a mixture of TO and EPC as a function of mole fraction. The solid line and diamonds (◆) represent the envelope point and the dashed line represents the collapse point. At a high mole fraction of EPC or low Π, the TO and EPC are miscible in the monolayer and have 2 degrees of freedom (F). At high Π and low mole fraction of EPC, a portion of the TO is in the monolayer while the remainder forms a bulk TO phase. When there is a bulk phase of TO the number of bulk phases (PB) increases to 2 while the number of surface phases (PS) remains at 1 and F reduces 1.
Figure 6
Figure 6
Bubble tensiometer experiment of EPC binding to a TO/W interface showing the relationship between γ (bottom) and bubble surface area (top) versus time. At time point zero a 16 μL bubble was created in a suspension containing EPC SUVs. The phospholipid adsorbed lowering γ to 20±0.8 mN/m (Panel A). The adsorption occurred without any lag period. After equilibrium γ was approached, the bubble volume was lowered from 16 to 8 μL. This prevented the bubble from falling off during the buffer exchange. The lipid was removed from the surrounding solution by flowing 250 mL of lipid free buffer through the cuvette from 22,070 to 22,664 seconds (Bold line in Panel B). There was a slight increase in γ during the exchange. During the exchange there is an increase in the noise of the data caused by the bubble moving due to turbulence in the cuvette. After the buffer exchange the bubble volume was either expanded or reduced at a constant rate of ±0.02 μL/sec (Panel B). After 2 compressions and expansions the bubble was oscillated at a period of 128 seconds and amplitude of 2 μL centered on different areas which show the relationship between Π and bubble area.
Figure 7
Figure 7
From the drop tensiometer data (Figure 6) a Π/area compression isotherm was constructed. The compressions and reexpansions (black), and oscillations (grey) all overlay one another, both within the same experiment and between experiments. This shows that compressions of EPC at a TO/W interface are reversible and shows little hysteresis. The range of Π for this experiment is limited between 0 and 28 mN/m. Above Π=28 mN/m (below γ=4mN/m) the bubble is released. When a new TO bubble was formed, the new clean TO/W interface had a γ of 32 mN/m (γ of a clean interface) and changes in area did not deviate γ from 32 mN/m.
Figure 8
Figure 8
By overlaying the collapse isotherms of EPC at an A/W interface from a Langmuir trough (Figure 2) and from the bubble tensiometer using equation 4 (Figure 5) it is clear that they have very similar slopes (A). By converting area per molecule to concentration the relationship between Π and Γ at the surface of an air bubble is shown (B).
Figure 9
Figure 9
A model of a mixed TO:EPC (ratio of 3.5:1) monolayer on a Langmuir trough at an A/W interface which is being isothermally compressed illustrates change in the monolayer as a function of Π and Γ (from Figure 5). Below the envelope point the lipids form a homogenous mixed monolayer (lower right panel). The fatty acid chains are in an expanded liquid state. As the surface density increased the chains are pushed closer together. At the envelope point the chains of the EPC and TO are more aligned with one another but still liquid (center right panel). Any further compression causes the TO to be expelled from the monolayer and create a new bulk hydrophobic phase outside of the monolayer (Top Right Panel). As Π increased more TO was ejected and the TO:EPC ratio of the monolayer was decreased. The red area of the molecules indicates a hydrophilic region on the molecule and the squiggly lines indicate the fatty acid chains. Above 45 mN/m, the collapse point, an EPC rich phase also separates out of the surface. At this point there are 3 bulk phases and 1 surface phase, which reduces the degrees of freedom to zero (F=3−3−1+1). Upon further compression the Π remains constant.
Figure 10
Figure 10
A)To calculate the concentration of EPC at the surface of a TO bubble, a mixed TO:EPC compression isotherm at a ratio of 3.5:1 (Figure 5, black) can be over laid with the compression isotherm of EPC on a TO/W interface (Figure 7, shown in red). To account for the fact that the mixed TO:EPC monolayer was compressed at an A/W interface, 12.1 mN/m was added to the value of the TO bubble Π because that is the collapse Π of pure TO (Fig. 2B). B) By converting from area per molecule to Γ (surface concentration of EPC) the relationship between Π and Γ is established (red). At the envelope point the composition of the monolayer is known, so the percentage of the molecules at the surface at these points is also known (black dots). Thus as the Π on the TO drop increases from 2 mN/m to 26 mN/m the mole percent of EPC is enriched from ~25% to ~90% and the amount of TO in the surface decreases in a reciprocal manner.

Similar articles

Cited by

References

    1. Mahley RW, Innerarity TL, Rall SC, Weisgraber KH. Journal of Lipid Research. 1984;25:1277. - PubMed
    1. Wustneck N, Wustneck R, Fainerman VB, Miller R, Pison U. Colloids and Surfaces B-Biointerfaces. 2001;21:191. - PubMed
    1. Brasaemle DL. Journal of Lipid Research. 2007;48:2547. - PubMed
    1. Small DM. The physical chemistry of lipids : from alkanes to phospholipids. Plenum Press; New York: 1986.
    1. Mohwald H. Phospholipid Monolayers. In: Lipowsky R, editor. Handbook of Biological Physics. Vol. 1. Elsevier Science B.V.; 1995. p. 187.

Publication types