. 2010 Feb 12:9:9.
doi: 10.1186/1475-2859-9-9.

Reduction of oxidative cellular damage by overexpression of the thioredoxin TRX2 gene improves yield and quality of wine yeast dry active biomass

Affiliations

Reduction of oxidative cellular damage by overexpression of the thioredoxin TRX2 gene improves yield and quality of wine yeast dry active biomass

Rocío Gómez-Pastor et al. Microb Cell Fact. .

Erratum in

  • Microb Cell Fact. 2012;11:31

Abstract

Background: Wine Saccharomyces cerevisiae strains, adapted to anaerobic must fermentations, suffer oxidative stress when they are grown under aerobic conditions for biomass propagation in the industrial process of active dry yeast production. Oxidative metabolism of sugars favors high biomass yields but also causes increased oxidation damage of cell components. The overexpression of the TRX2 gene, coding for a thioredoxin, enhances oxidative stress resistance in a wine yeast strain model. The thioredoxin and also the glutathione/glutaredoxin system constitute the most important defense against oxidation. Trx2p is also involved in the regulation of Yap1p-driven transcriptional response against some reactive oxygen species.

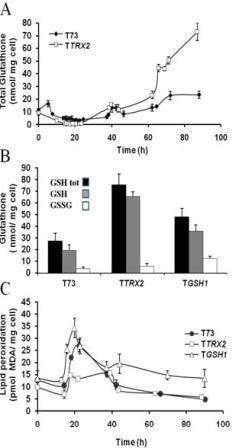
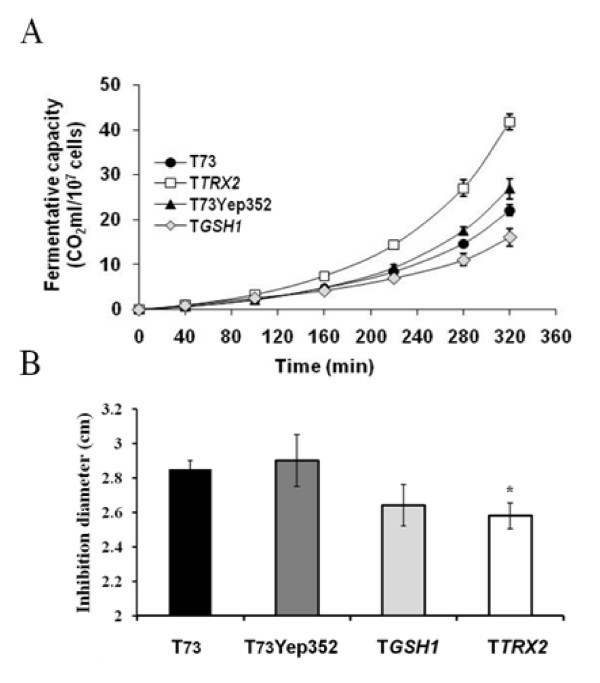
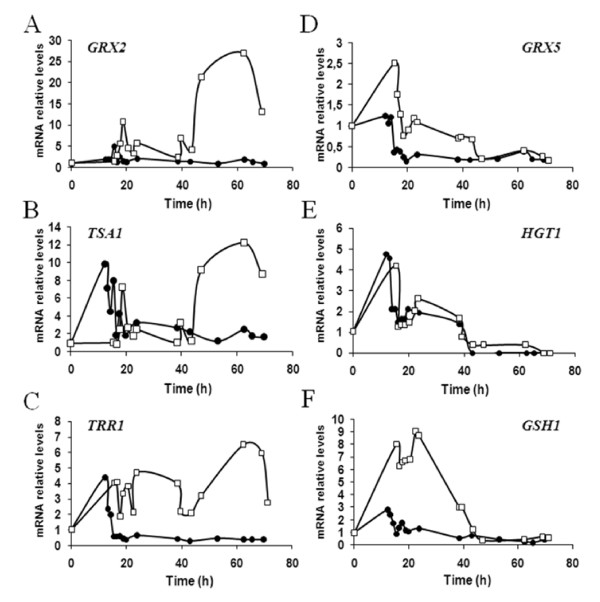
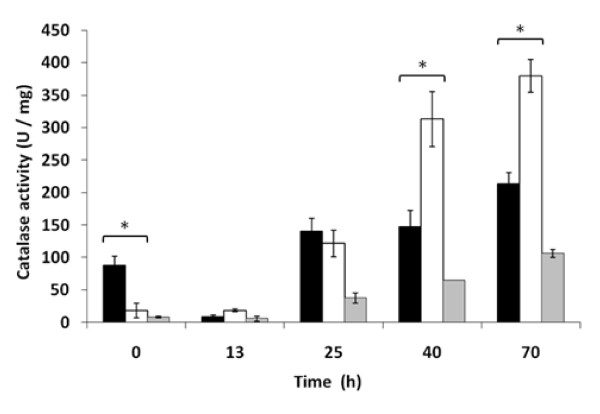
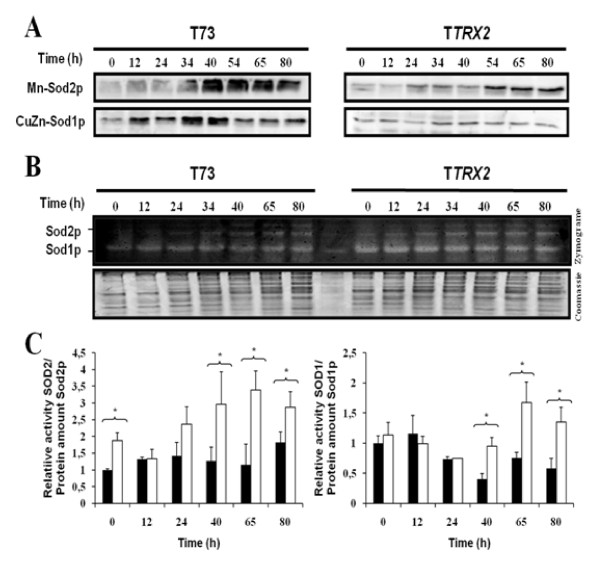
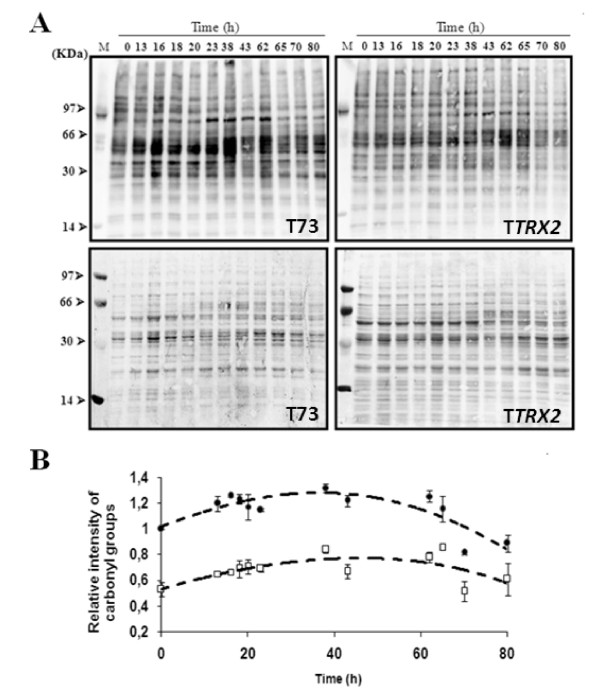
Results: Laboratory scale simulations of the industrial active dry biomass production process demonstrate that TRX2 overexpression increases the wine yeast final biomass yield and also its fermentative capacity both after the batch and fed-batch phases. Microvinifications carried out with the modified strain show a fast start phenotype derived from its enhanced fermentative capacity and also increased content of beneficial aroma compounds. The modified strain displays an increased transcriptional response of Yap1p regulated genes and other oxidative stress related genes. Activities of antioxidant enzymes like Sod1p, Sod2p and catalase are also enhanced. Consequently, diminished oxidation of lipids and proteins is observed in the modified strain, which can explain the improved performance of the thioredoxin overexpressing strain.

Conclusions: We report several beneficial effects of overexpressing the thioredoxin gene TRX2 in a wine yeast strain. We show that this strain presents an enhanced redox defense. Increased yield of biomass production process in TRX2 overexpressing strain can be of special interest for several industrial applications.


Figures

Figure 1
Figure 1
Improved performance of TTRX2 strain in biomass production process. (A) Biomass produced (continuous line) and oxygen saturation (discontinuous line) along bench-top trials of biomass propagation for T73 (black diamond), TTRX2 (white square) and TGSH1 (white triangle) strains by measuring OD600 from diluted samples. Average of three independent experiments and standard deviations are shown. (B) Fermentative capacity of yeast biomass collected at the end of the batch and fed-batch stages of growth in bench-top trials of ADY production. Biomass from wild-type T73 (black bars) and TTRX2 (white bars) were dehydrated until 8% moisture before performing the analysis. Data were normalized to the fermentative capacity of the batch sample from T73 strain. Average of three independent experiments and standard deviations are shown. Significantly different values compared to the control (p < 0.001) were marked by asterisk. (C) Sugar consumption profiles during microvinification experiments using natural Bobal must for T73 (closed symbols) and TTRX2 (open symbols) strains. The start of must fermentation was followed in detail during the first 6 hours for both strains T73 (closed symbol) and TTRX2 (open symbol). Averages were obtained from two independent experiments with three technical replicates for each one.
Figure 2
Figure 2
Fermentative capacity and H2O2 growth inhibition assays for the improved TTRX2 strain compared to control T73 and T73Yep352 strains. Fermentative capacity assays on YPGF medium for T73 (black circle), TTRX2 (white square), T73Yep352 (black triangle) and TGSH1 (white diamond) (A). Cells grown for 24 hours molasses medium were dehydrated and then assayed for CO2 production. (B) Determination of inhibition diameters produced with 10 μl of 30% H2O2 into paper discs on the growth of stationary cultures from T73, T73Yep352 and TTRX2 on YPD plates. Average of three independent experiments and standard deviations are shown. Significant differences were observed only for TTRX2 strain.
Figure 3
Figure 3
Analysis of oxidative stress gene markers along biomass propagation bench-top trials. mRNA relative levels for: (A) GRX2 (cytoplasmic glutaredoxin 2), (B) TSA1 (thioredoxin peroxidase), (C) TRR1 (thioredoxin reductase), (D) GRX5 (mitochondrial glutaredoxin), (E) HGT1 (high affinity glutathione transporter), and (F) GSH1 (γ-glutamylcysteine synthetase). Data from three independent experiments were normalized to 28S rRNA levels and to the probe-specific radioactivity. Results from one representative experiment are showed for T73 (closed symbols) and TTRX2 (open symbols).
Figure 4
Figure 4
Catalase activity along bench-top trials of biomass propagation for T73 (black bars), TGSH1 (grey bars) and TTRX2 (white bars) strains. Average of three independent experiments and standard deviations are shown. Catalase activity was significantly different (p < 0.05) at time points marked by asterisks.
Figure 5
Figure 5
Superoxide dismutase activity along bench-top trials of biomass propagation for T73 (black bars) and TTRX2 (white bars) strains. Western blot analysis of cell extracts against Sod1p and Sod2p after electrophoresis under denaturing conditions (A). Panel B shows Zymogram obtained by native gel electrophoresis of cell extracts and SOD activity staining. (C) Mn-SOD and CuZn-SOD activity was calculated from zymogram density analysis and normalized to total protein amount from Coomassie stained gel. The specific activity was obtained as a result to normalized activity data to Sod1p and Sod2p protein amount from western blot analysis. In order to avoid technical errors as different exposure times, western blots and zymogram for both strains were carried out simultaneously in three independent experiments.
Figure 6
Figure 6
Glutathione and lipid peroxidation analysis along bench-top trials of biomass propagation. Total intracellular glutathione profile along biomass propagation bench-top trials for T73 (closed symbols) and TTRX2 (open symbols) strains (A). Glutathione levels at the end of the biomass propagation experiments for T73, TTRX2 and the T73 derivative overexpressing the GSH1 gene strain (TGSH1) (B). Total glutathione content (black bars), reduced GSH (dark grey bars) and oxidized GSSG (white bars) were determined. (C) Lipid peroxidation profile for T73 (black circle), TTRX2 (white square) and TGSH1 (white triangle) strains. The mean of three independent experiments and standard deviations are shown.
Figure 7
Figure 7
Protein carbonylation along bench-top trials of biomass propagation. Western analysis of oxidatively damaged proteins (top panels) and total protein stain (bottom panels) for T73 (left panels) and TTRX2 (right panels) strains (A). Panel B shows quantification of protein carbonyl content of T73 (black circles) and TTRX2 (open squares) data shown in panel A. Data was normalized to total protein in Coomassie stained gels. In order to avoid technical errors due to different exposure times, comparison between both strains was carried out in the same experiment. The mean of three independent experiments and standard deviations are shown. Protein carbonylation in samples from both strains between 0 and 65 h were significantly different with p < 0.01, and samples at 70 and 80 h were significantly different with p < 0.05.

References

    1. Pretorius IS. Tailoring wine yeast for the new millennium: novel approaches to the ancient art of winemaking. Yeast. 2000;16:675–729. doi: 10.1002/1097-0061(20000615)16:8<675::AID-YEA585>3.0.CO;2-B. - DOI - PubMed
    1. Dequin S. The potential of genetic engineering for improving brewing, wine-making and baking yeasts. Appl Microbiol Biotechnol. 2001;56:577–588. doi: 10.1007/s002530100700. - DOI - PubMed
    1. Querol A, Barrio E, Ramon D. Population dynamics of natural Saccharomyces strains during wine fermentation. Int J Food Microbiol. 1994;21:315–323. doi: 10.1016/0168-1605(94)90061-2. - DOI - PubMed
    1. Manzanares P, Ramon D, Querol A. Screening of non-Saccharomyces wine yeasts for the production of beta-D-xylosidase activity. Int J Food Microbiol. 1999;46:105–112. doi: 10.1016/S0168-1605(98)00186-X. - DOI - PubMed
    1. Schuller D, Casal M. The use of genetically modified Saccharomyces cerevisiae strains in the wine industry. Appl Microbiol Biotechnol. 2005;68:292–304. doi: 10.1007/s00253-005-1994-2. - DOI - PubMed

Publication types

LinkOut - more resources