

Genomics based analysis of interactions between developing B-lymphocytes and stromal cells reveal complex interactions and two-way communication
- PMID: 20152025
- PMCID: PMC2830985
- DOI: 10.1186/1471-2164-11-108
Genomics based analysis of interactions between developing B-lymphocytes and stromal cells reveal complex interactions and two-way communication
Abstract
Background: The use of functional genomics has largely increased our understanding of cell biology and promises to help the development of systems biology needed to understand the complex order of events that regulates cellular differentiation in vivo. One model system clearly dependent on the integration of extra and intra cellular signals is the development of B-lymphocytes from hematopoietic stem cells in the bone marrow. This developmental pathway involves several defined differentiation stages associated with specific expression of genes including surface markers that can be used for the prospective isolation of the progenitor cells directly from the bone marrow to allow for ex vivo gene expression analysis. The developmental process can be simulated in vitro making it possible to dissect information about cell/cell communication as well as to address the relevance of communication pathways in a rather direct manner. Thus we believe that B-lymphocyte development represents a useful model system to take the first steps towards systems biology investigations in the bone marrow.
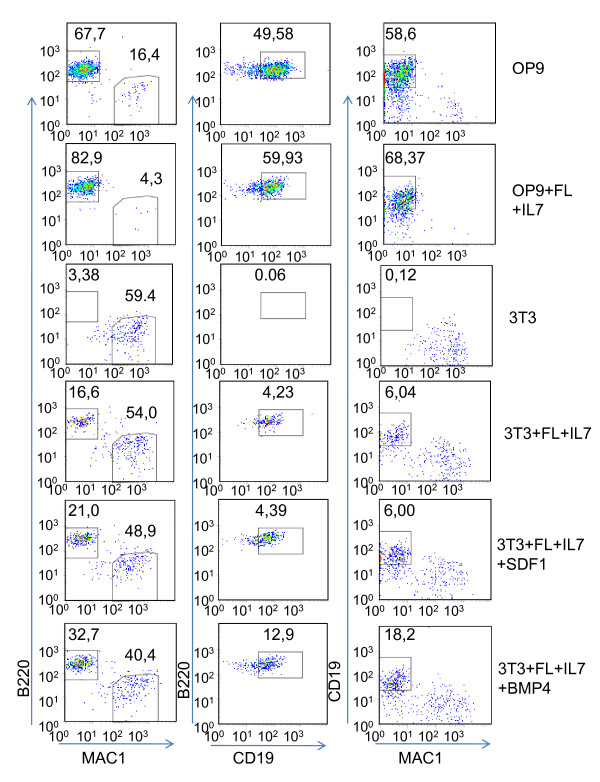
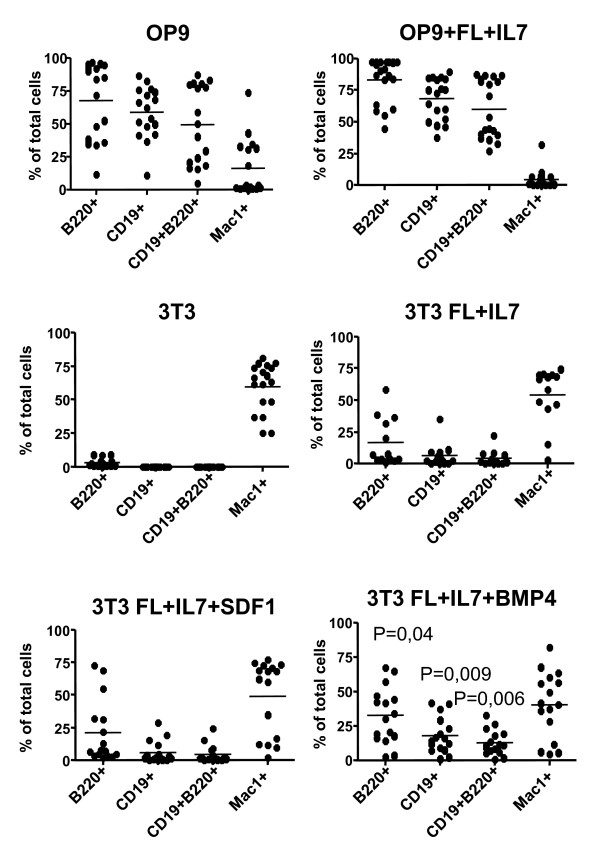
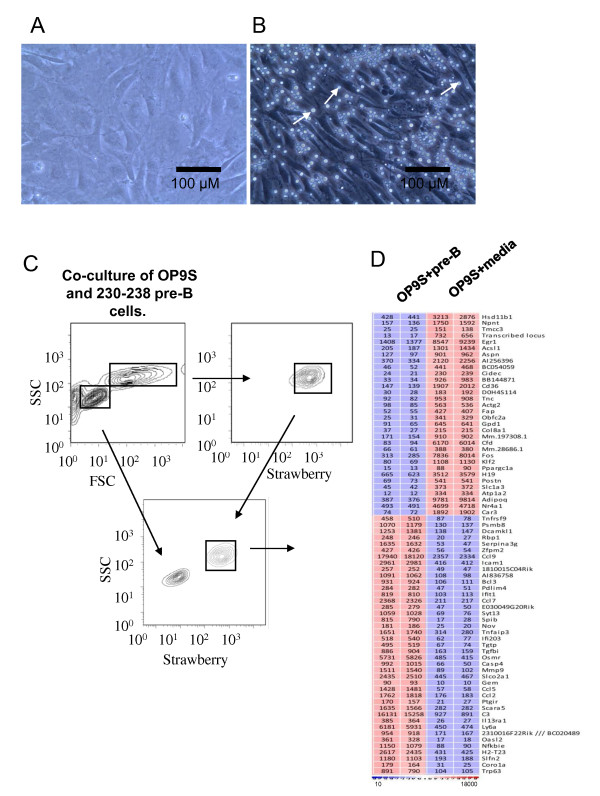
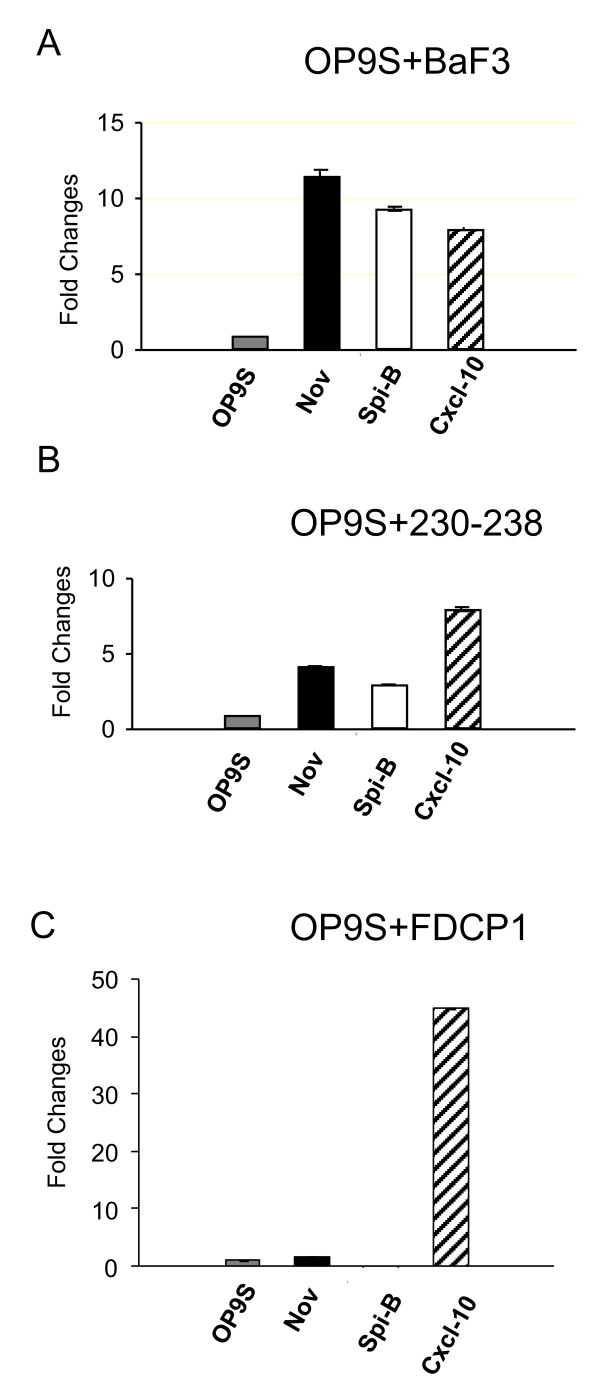
Results: In order to identify extra cellular signals that promote B lymphocyte development we created a database with approximately 400 receptor ligand pairs and software matching gene expression data from two cell populations to obtain information about possible communication pathways. Using this database and gene expression data from NIH3T3 cells (unable to support B cell development), OP-9 cells (strongly supportive of B cell development), pro-B and pre-B cells as well as mature peripheral B-lineage cells, we were able to identify a set of potential stage and stromal cell restricted communication pathways. Functional analysis of some of these potential ways of communication allowed us to identify BMP-4 as a potent stimulator of B-cell development in vitro. Further, the analysis suggested that there existed possibilities for progenitor B cells to send signals to the stroma. The functional consequences of this were investigated by co-culture experiments revealing that the co-incubation of stromal cells with B cell progenitors altered both the morphology and the gene expression pattern in the stromal cells.
Conclusions: We believe that this gene expression data analysis method allows for the identification of functionally relevant interactions and therefore could be applied to other data sets to unravel novel communication pathways.
Figures
Similar articles
-
Ontogenic emergence of the hematon, a morphogenetic stromal unit that supports multipotential hematopoietic progenitors in mouse bone marrow.Blood. 2000 Dec 1;96(12):3763-71. Blood. 2000. PMID: 11090058
-
The Cxcl12, periostin, and Ccl9 genes are direct targets for early B-cell factor in OP-9 stroma cells.J Biol Chem. 2007 May 11;282(19):14454-62. doi: 10.1074/jbc.M610263200. Epub 2007 Mar 20. J Biol Chem. 2007. PMID: 17374609
-
Fetal liver pro-B and pre-B lymphocyte clones: expression of lymphoid-specific genes, surface markers, growth requirements, colonization of the bone marrow, and generation of B lymphocytes in vivo and in vitro.Mol Cell Biol. 1992 Feb;12(2):518-30. doi: 10.1128/mcb.12.2.518-530.1992. Mol Cell Biol. 1992. PMID: 1346335 Free PMC article.
-
Microenvironmental niches in the bone marrow required for B-cell development.Nat Rev Immunol. 2006 Feb;6(2):107-16. doi: 10.1038/nri1780. Nat Rev Immunol. 2006. PMID: 16491135 Review.
-
Regulation of B cell differentiation by bone marrow stromal cells.Int J Cell Cloning. 1992 Jan;10(1):12-7. doi: 10.1002/stem.5530100104. Int J Cell Cloning. 1992. PMID: 1552220 Review.
Cited by
-
RAG Recombinase as a Selective Pressure for Genome Evolution.Genome Biol Evol. 2016 Dec 14;8(11):3364-3376. doi: 10.1093/gbe/evw261. Genome Biol Evol. 2016. PMID: 27979968 Free PMC article.
-
The miR-23a~27a~24-2 microRNA cluster buffers transcription and signaling pathways during hematopoiesis.PLoS Genet. 2017 Jul 13;13(7):e1006887. doi: 10.1371/journal.pgen.1006887. eCollection 2017 Jul. PLoS Genet. 2017. PMID: 28704388 Free PMC article.
-
Compartmentalization of bone morphogenetic proteins and their antagonists in lymphoid progenitors and supporting microenvironments and functional implications.Immunology. 2011 Nov;134(3):349-59. doi: 10.1111/j.1365-2567.2011.03495.x. Immunology. 2011. PMID: 21978004 Free PMC article.
-
Molecular characterization of prospectively isolated multipotent mesenchymal progenitors provides new insight into the cellular identity of mesenchymal stem cells in mouse bone marrow.Mol Cell Biol. 2013 Feb;33(4):661-77. doi: 10.1128/MCB.01287-12. Epub 2012 Nov 26. Mol Cell Biol. 2013. PMID: 23184664 Free PMC article.
-
Expression of mesenchyme-specific gene signatures by follicular dendritic cells: insights from the meta-analysis of microarray data from multiple mouse cell populations.Immunology. 2011 Aug;133(4):482-98. doi: 10.1111/j.1365-2567.2011.03461.x. Epub 2011 Jun 3. Immunology. 2011. PMID: 21635249 Free PMC article.
References
-
- Pronk CJ, Attema J, Rossi DJ, Sigvardsson M, Bryder D. Deciphering developmental stages of adult myelopoiesis. Cell Cycle. 2008;7(6):706–713. - PubMed
Publication types
MeSH terms
Substances
LinkOut - more resources
Full Text Sources
Molecular Biology Databases
Miscellaneous
