

Semi-automatic quantification of 4D left ventricular blood flow
- PMID: 20152026
- PMCID: PMC2831022
- DOI: 10.1186/1532-429X-12-9
Semi-automatic quantification of 4D left ventricular blood flow
Abstract
Background: The beating heart is the generator of blood flow through the cardiovascular system. Within the heart's own chambers, normal complex blood flow patterns can be disturbed by diseases. Methods for the quantification of intra-cardiac blood flow, with its 4D (3D+time) nature, are lacking. We sought to develop and validate a novel semi-automatic analysis approach that integrates flow and morphological data.
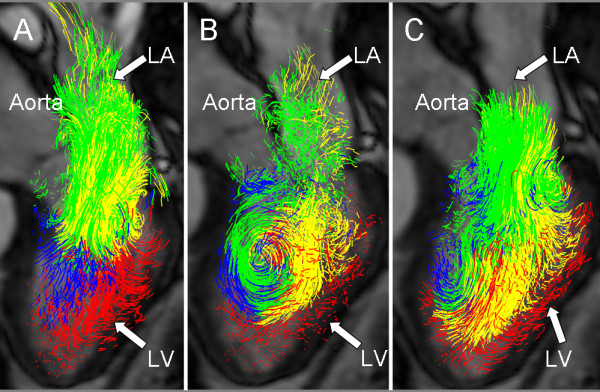
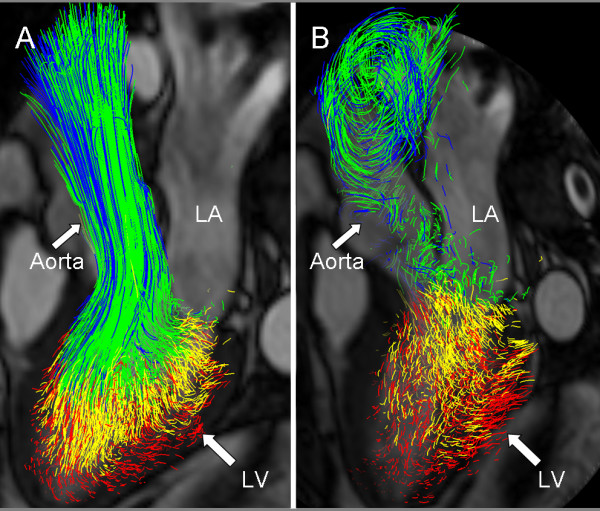
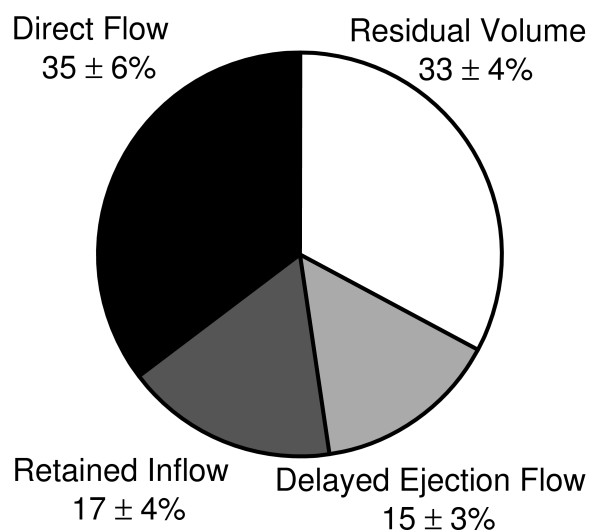
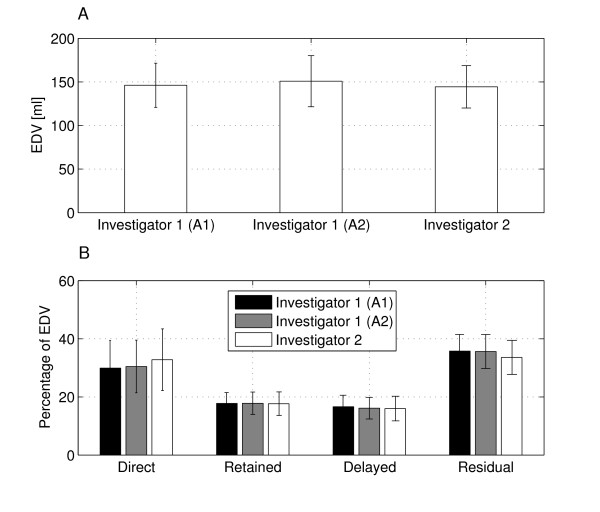
Method: In six healthy subjects and three patients with dilated cardiomyopathy, three-directional, three-dimensional cine phase-contrast cardiovascular magnetic resonance (CMR) velocity data and balanced steady-state free-precession long- and short-axis images were acquired. The LV endocardium was segmented from the short-axis images at the times of isovolumetric contraction (IVC) and isovolumetric relaxation (IVR). At the time of IVC, pathlines were emitted from the IVC LV blood volume and traced forwards and backwards in time until IVR, thus including the entire cardiac cycle. The IVR volume was used to determine if and where the pathlines left the LV. This information was used to automatically separate the pathlines into four different components of flow: Direct Flow, Retained Inflow, Delayed Ejection Flow and Residual Volume. Blood volumes were calculated for every component by multiplying the number of pathlines with the blood volume represented by each pathline. The accuracy and inter- and intra-observer reproducibility of the approach were evaluated by analyzing volumes of LV inflow and outflow, the four flow components, and the end-diastolic volume.
Results: The volume and distribution of the LV flow components were determined in all subjects. The calculated LV outflow volumes [ml] (67 +/- 13) appeared to fall in between those obtained by through-plane phase-contrast CMR (77 +/- 16) and Doppler ultrasound (58 +/- 10), respectively. Calculated volumes of LV inflow (68 +/- 11) and outflow (67 +/- 13) were well matched (NS). Low inter- and intra-observer variability for the assessment of the volumes of the flow components was obtained.
Conclusions: This semi-automatic analysis approach for the quantification of 4D blood flow resulted in accurate LV inflow and outflow volumes and a high reproducibility for the assessment of LV flow components.
Figures
References
-
- Jacobs LE, Kotler MN, Parry WR. Flow patterns in dilated cardiomyopathy: a pulsed-wave and color flow Doppler study. J Am Soc Echocardiogr. 1990;3:294–302. - PubMed
-
- Houlind K, Schroeder AP, Stodkilde-Jorgensen H, Paulsen PK, Egeblad H, Pedersen EM. Intraventricular dispersion and temporal delay of early left ventricular filling after acute myocardial infarction. Assessment by magnetic resonance velocity mapping. Magn Reson Imaging. 2002;20:249–260. doi: 10.1016/S0730-725X(02)00495-2. - DOI - PubMed
Publication types
MeSH terms
LinkOut - more resources
Full Text Sources
Other Literature Sources
Miscellaneous
