. 2010 Jan 14;65(1):53-65.
doi: 10.1016/j.neuron.2009.12.007.

Delivery of GABAARs to synapses is mediated by HAP1-KIF5 and disrupted by mutant huntingtin

Affiliations

Delivery of GABAARs to synapses is mediated by HAP1-KIF5 and disrupted by mutant huntingtin

Alison E Twelvetrees et al. Neuron. .

Abstract

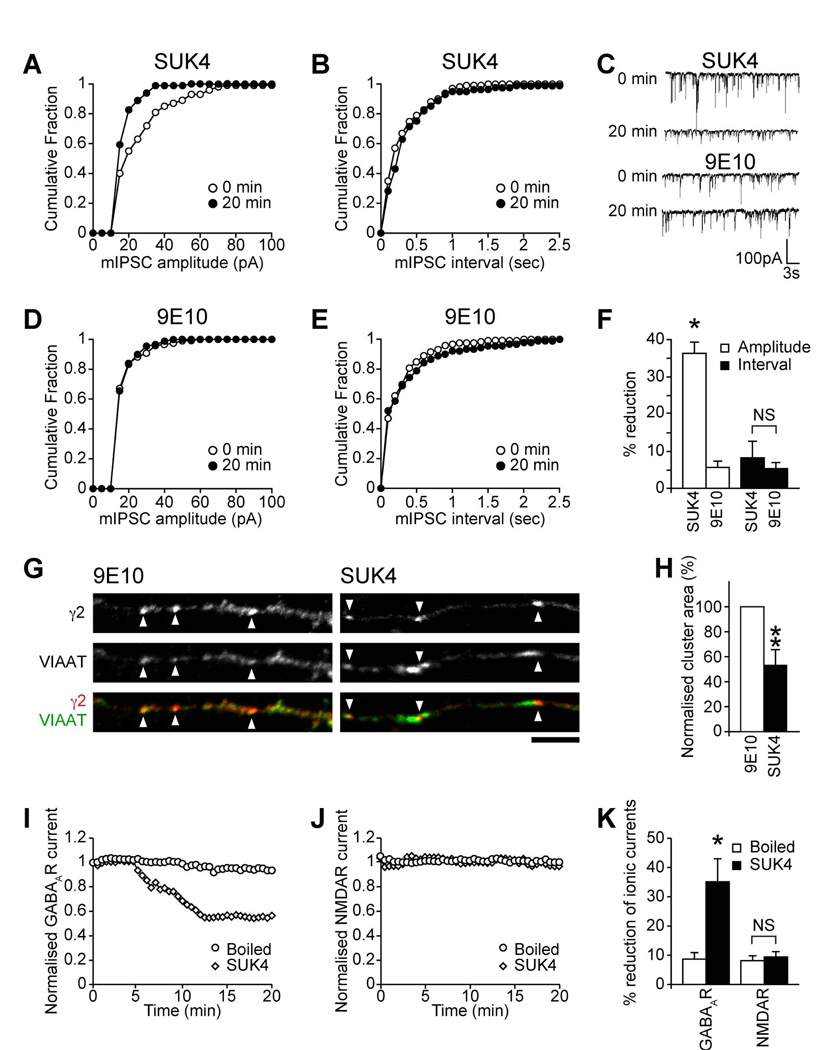
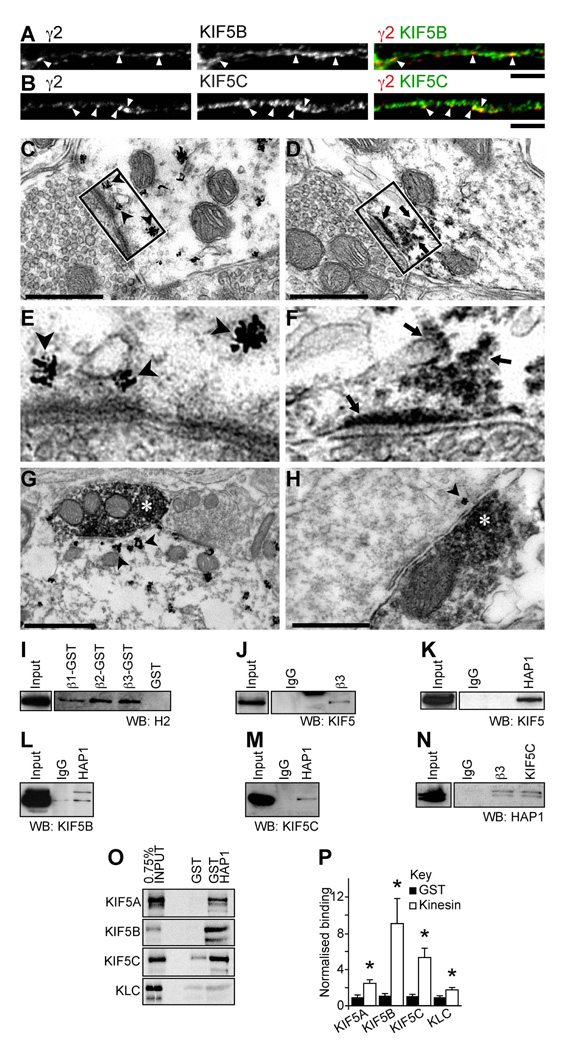
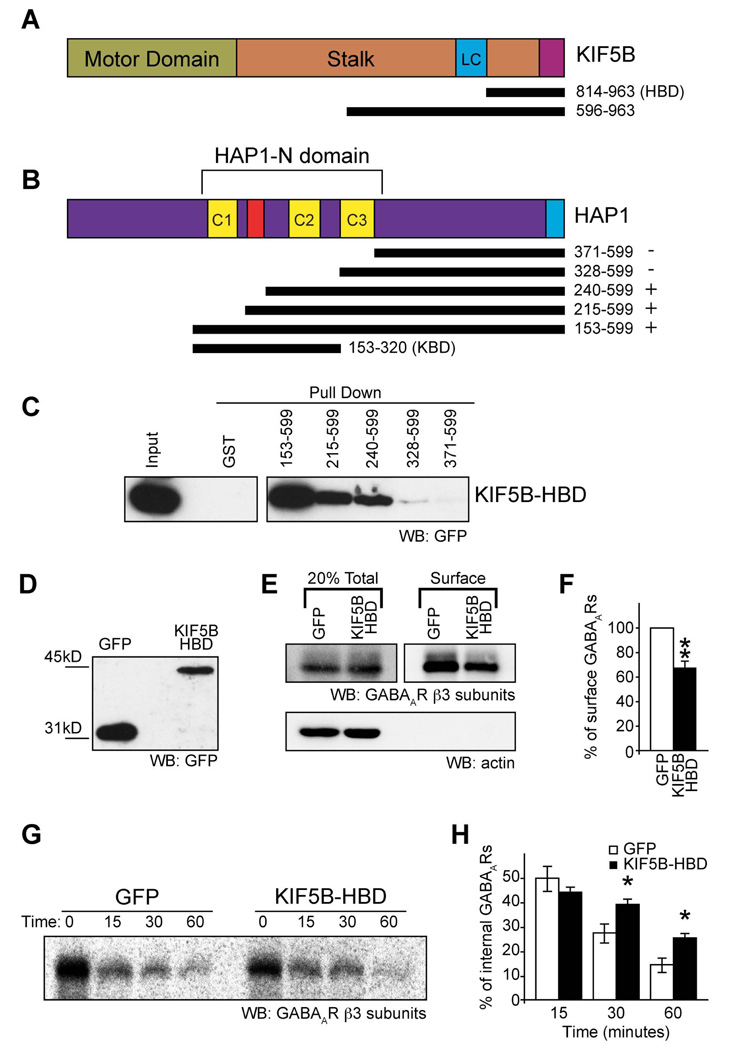
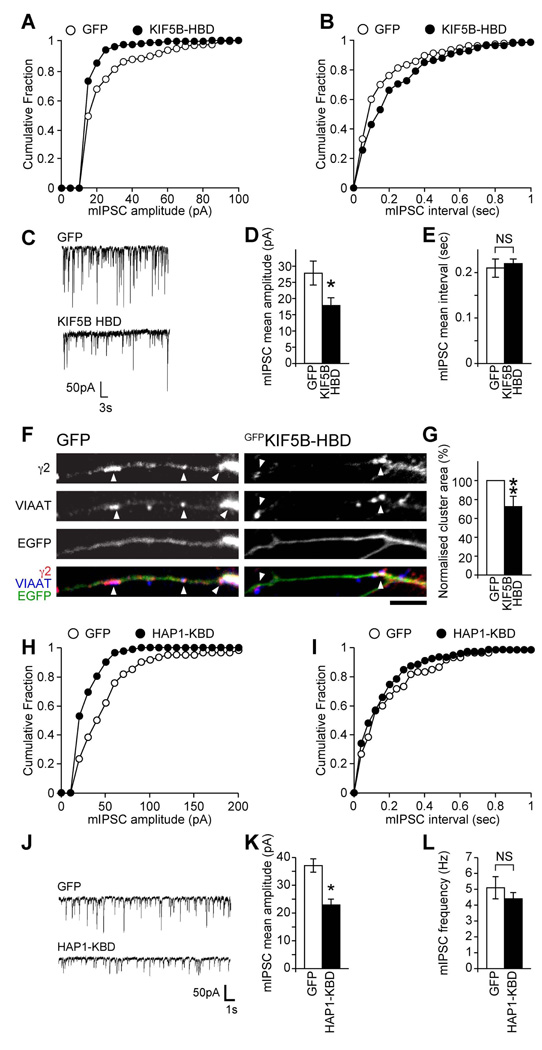
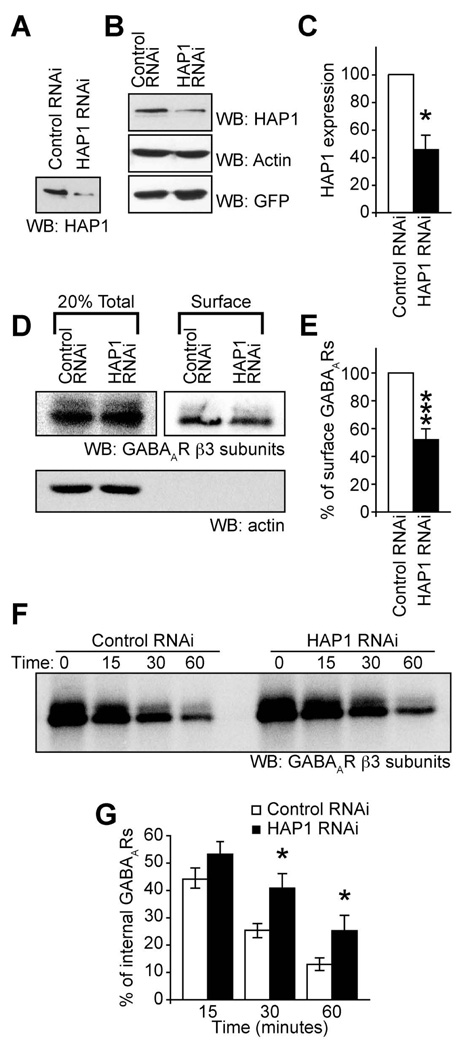
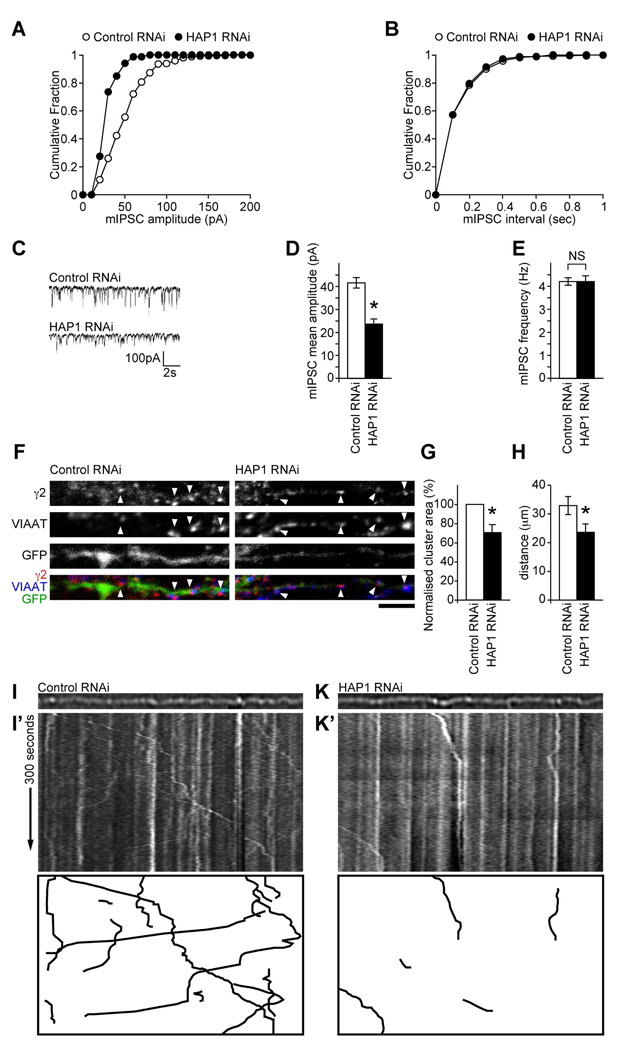
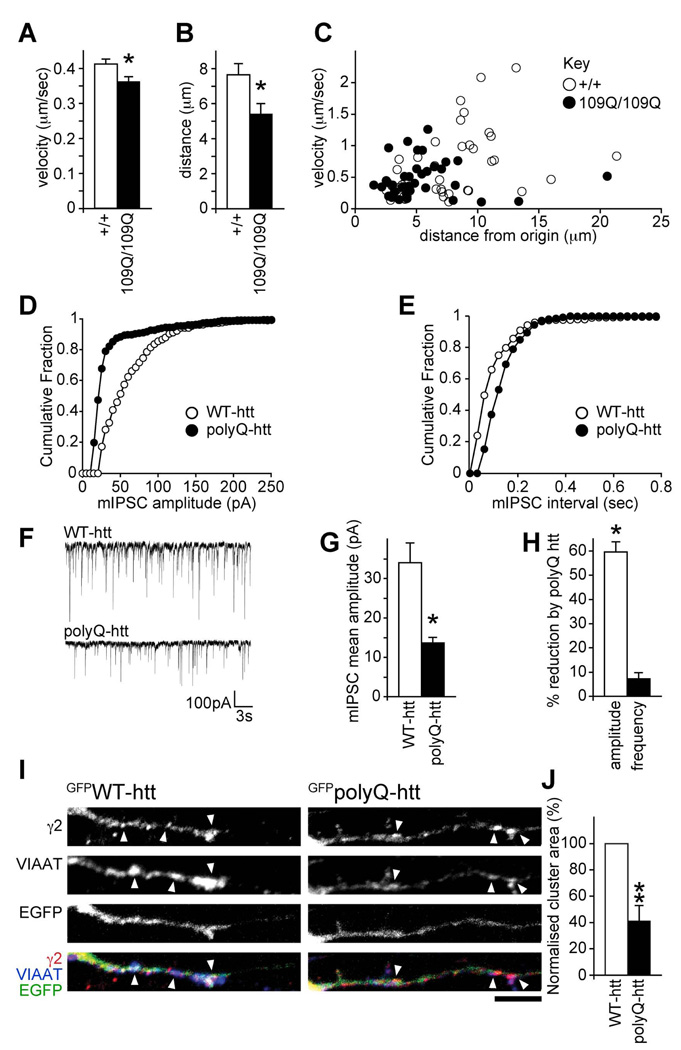
The density of GABA(A) receptors (GABA(A)Rs) at synapses regulates brain excitability, and altered inhibition may contribute to Huntington's disease, which is caused by a polyglutamine repeat in the protein huntingtin. However, the machinery that delivers GABA(A)Rs to synapses is unknown. We demonstrate that GABA(A)Rs are trafficked to synapses by the kinesin family motor protein 5 (KIF5). We identify the adaptor linking the receptors to KIF5 as the huntingtin-associated protein 1 (HAP1). Disrupting the HAP1-KIF5 complex decreases synaptic GABA(A)R number and reduces the amplitude of inhibitory postsynaptic currents. When huntingtin is mutated, as in Huntington's disease, GABA(A)R transport and inhibitory synaptic currents are reduced. Thus, HAP1-KIF5-dependent GABA(A)R trafficking is a fundamental mechanism controlling the strength of synaptic inhibition in the brain. Its disruption by mutant huntingtin may explain some of the defects in brain information processing occurring in Huntington's disease and provides a molecular target for therapeutic approaches.


Figures

Figure 1
Figure 1. KIF5 delivers GABAARs to synapses
(A–F) mIPSCs in neurons dialyzed with either SUK4 or control 9E10 antibodies. Cumulative distribution plots show mIPSC amplitudes shifted leftward in SUK4-dialyzed (A) but not control 9E10 dialyzed (D) neurons at t = 20 compared to t = 0 min. There is no change in mIPSC interval for either SUK4 or 9E10 (B, E). Representative traces reveal time-dependent reduction in mIPSC sizes upon dialysis of SUK4, but not control 9E10 antibody (C). Summary bar graphs (F) show the percentage (mean ± s.e.m.) reduction of mIPSC amplitude and interval produced by SUK4 or 9E10 after 20 minutes of antibody dialysis (SUK4, n = 7; 9E10, n = 5; *, P < 0.05). (G, H) Immunofluorescence and CLSM reveals that SUK4 treatment of neurons reduces synaptic GABAAR cluster area (arrowheads) compared to 9E10 control (scale bar = 5µm). Error bars, s.e.m.; n = 3 experiments, 15 neurons; **, P < 0.01, (Students t-test). (I–K) Evoked whole cell recordings of GABAAR currents (I) and NMDAR currents (J) were recorded from neurons dialyzed with either the SUK4 or boiled (inactive) antibody control. SUK4 antibody caused a gradual reduction on GABAAR currents, but the boiled antibody control had no affect. Dialysis of either antibody failed to affect NMDAR currents. (K) Summary bar graph showing the percentage reduction in ionic currents. Error bars, s.e.m.; n = 6–7; *. P < 0.05.
Figure 2
Figure 2. Endogenous HAP1/KIF5/GABAAR complexes
(A–H) KIF5 colocalises with GABAARs and is found at inhibitory post-synapses. (A, B) Neurons co-stained with antibodies to the GABAAR γ2 subunit and either anti-KIF5B (A) or anti-KIF5C (B) (green; scale bar = 5µm). Both KIF5B and KIF5C are found to colocalize (yellow) with a subset of γ2 containing GABAAR clusters in dendrites (arrowheads). (C–H) Ultrastructural localization of KIF5 heavy chains (scale bars, C, D & H = 0.5µm; G = 1µm). Discontinuous deposits of gold-toned silver-intensified nanogold particles immunolabelling KIF5 (C, E, G & H arrowheads) or electron dense HRP reaction product (D and F, arrows) are frequently seen close to the postsynaptic membrane opposed to presynaptic boutons containing pleiomorphic populations of vesicles indicative of inhibitory synapses (C, D, E & F) or GAD HRP immunolabelled boutons (G & H, white star, from spinal cord and hippocampal tissue respectively). (D) KIF5C localised at the inhibitory postsynaptic membrane. (E) Boxed region in C. (F) Boxed region in D. (E and F) KIF5 is frequently seen associated with vesicles close to the postsynaptic membrane. (I–N) Co-precipitation and pull down assays of GABAARs, KIF5 and HAP1 from rat brain reveals they form complexes in vivo (WB = Western Blot; Input = 5–15% of the brain lysate present in the assay; each blot represents at least 3 repetitions). Western blots of pull downs with GST fusion proteins of the intracellular loops of GABAAR subunits β1, 2 and 3 show they were able to bring down kinesin heavy chains (I) as was immunoprecicitation with antibodies against the β3 subunits of GABAARs (J). HAP1 antibodies also immunoprecipitate KIF5 when western blots are probed with a pan KIF5 antibody (K) or with specific antibodies against both KIF5B (L) and KIF5C (M). In reverse immunoprecipitation experiments with anti-GABAAR β3 antibodies and anti-KIF5C, HAP1a and HAP1b are present in immune pellets (N). (O, P) The kinesin motor subunits KIF5A–C and kinesin light chain (KLC) were translated in vitro and labelled with [35S]-methionine. The resulting protein was subjected to pull down assay with GST-HAP1, and GST alone as control, separated by SDS-PAGE (O) and radioactivity detected using a phosphor storage screen. (P) Summary bar graph of relative binding of KIF5 subunits to HAP1. Error bars, s.e.m.; n = 5; *, P < 0.05, Students t-test.
Figure 3
Figure 3. A HAP1-KIF5 complex mediates re-insertion of GABAARs from the intracellular pool into the surface membrane
(A–C) Identification of the binding sites on HAP1 and KIF5. (A,B) Schematic diagrams of KIF5 and HAP1 constructs relative to the full-length proteins. (C) GFPKIF5B residues 814–963 (designated KIF5B-HAP1 Binding Domain: KIF5B-HBD) is sufficient for binding to a central region of HAP1 (residues 153–328) in a pull down assay. (D) GFP and GFPKIF5B-HBD expression in lysates from transfected neurons used for biotinylation assays (E–H) detected by western blotting (WB) with GFP antibodies. (E, F) Expression of KIF5B-HBD reduces surface expression of GABAARs in neurons as revealed by surface biotinylation and western blotting with anti-GABAAR-β3 subunit antibodies. Surface receptors were labelled with biotin and surface expression normalised to the total number of receptors in the system. Actin blot (lower panel, E) shows actin present in total lysates (the saved 20% fraction) of cells, but exclusion from the surface only biotinylated fraction. (F) Summary bar graph shows surface expression normalised to GFP control (n = 8 experiments; Error bars, s.e.m.; ** P < 0.005, Students t-test). (G,H) Expression of KIF5-HBD reduces re-insertion of internalised GABAARs. (G) A representative western blot of the re-insertion time course, bands represent the protected internal pool of GABAARs following 0, 15, 30 and 60 minutes of re-insertion. The loss of biotinylated GABAARs provides a measure of receptor re-insertion. (H) Expression of GFPKIF5B-HBD causes a reduced rate of reinsertion shown by increased levels of internal receptors at 30 and 60 minute time points (n = 5; Error bars, s.e.m.; *, P < 0.05, Students t-test)
Figure 4
Figure 4. A HAP1-KIF5 complex can modulate inhibitory synaptic transmission
(A–E) Whole-cell recordings of mIPSCs from neurons transfected with GFPKIF5B-HBD or GFP control. (C) Representative traces demonstrating reduction in mIPSC amplitudes in cells transfected with GFPKIF5B-HBD compared to GFP-transfected cells. Cumulative distribution plots show the mIPSC amplitude shifts to smaller amplitudes in neurons transfected with GFPKIF5B-HBD (A), whilst there is no change in mIPSC interval (B). Summary bar graphs (D, E) show the average (mean ± s.e.m.) mIPSC amplitude and interval of transfected neurons (GFP, n = 5; KIF5B-HBD, n = 6; *, P < 0.05). (F, G) GABAAR cluster analysis reveals that neurons expressing KIF5B-HBDGFP show reduction in synaptic γ2 clusters (arrowheads) compared to GFP control expressing cells (scale bar = 5 µm). Error bars, s.e.m.; n = 5 experiments, 26–27 neurons; **: P < 0.01, (Students t-test). (H–L) Whole-cell recordings of mIPSCs from neurons transfected with GFPHAP1-KBD or GFP control. (J) Representative traces demonstrating reduction in mIPSC amplitude in cells transfected with GFPHAP1-KBD compared to GFP-transfected cells. Cumulative distribution plots show the mIPSC amplitude shifts to smaller amplitudes in neurons transfected with GFPHAP1-KBD (H), whilst there is no change in mIPSC interval (I). Summary bar graphs (K, L) show the average (mean ± s.e.m.) mIPSC amplitude and frequency of transfected neurons (GFP, n = 8; HAP1-KBD, n = 7; *, P < 0.05).
Figure 5
Figure 5. HAP1 knockdown disrupts surface targeting of GABAARs
(A–C) Western blots showing knockdown with HAP1 RNAi compared to a scrambled control RNAi of exogenous HAP1 expressed in HEK cells (A) or endogenous HAP1 in neurons (B). (C) Summary bar graph of knock down in neurons with HAP1 expression normalised to actin. Error bars, s.e.m.; n = 3; P < 0.05, Students t-test. (D, E) Expression of HAP1 RNAi reduces surface expression of GABAARs in neurons as revealed by surface biotinylation and western blotting with anti GABAAR-β3 subunit antibodies (n = 6 experiments; error bars, s.e.m.; *** P < 0.0005, Students t-test). Actin blot (D, lower panel) shows actin present in total lysates of cells, but exclusion from the surface only purified fraction of protein. (F, G) Expression of HAP1 RNAi reduces re-insertion of internalized GABAARs. (n = 9; Error bars, s.e.m.; *, P < 0.05, Students t-test). (F) A representative western blot of the re-insertion time course. (G) Expression of GFPKIF5B-HBD causes a reduced rate of re-insertion shown by increased levels of internal receptors at 30 and 60 minute time points. Error bars, s.e.m.; n = 7–9; * P < 0.05, Students t-test.
Figure 6
Figure 6. HAP1 knockdown disrupts synaptic targeting and trafficking of GABAARs
(A–E) Whole-cell recordings of mIPSCs from neurons transfected with HAP1 RNAi or scrambled RNAi control. (C) Representative traces demonstrating reduction in mIPSC sizes in cells transfected with HAP1 RNAi, compared to scrambled control transfected cells. Cumulative distribution plots show the mIPSC amplitude shifts to smaller amplitudes in neurons transfected with HAP1 RNAi (A), whilst there is no change in mIPSC interval (B). Summary bar graphs (D, E) show the average (mean ± s.e.m.) mIPSC amplitude and frequency of transfected neurons (Control RNAi, n = 7; HAP1 RNAi, n = 8; *, P < 0.05). (F,G) GABAAR cluster analysis reveals that neurons expressing HAP1 RNAi show reduction in synaptic γ2 clusters (arrowheads) compared to scrambled control expressing cells (scale bar = 5 µm). Error bars, s.e.m.; n = 3 experiments, 24–25 neurons; *, P < 0.05, (Students t-test). (H–K’) The trafficking of γ2GFP-GABAAR vesicles in neurons co-expressing either control RNAi or HAP1 RNAi were analysed by video microscopy. (H) Distance travelled ± s.e.m (µm) by γ2GFP-GABAAR vesicles was reduced in neurons expressing the HAP1 RNAi compared to controls (n = 45 tracks each over 4 independent experiments and 9–14 cells; *, P < 0.05, Students t-test). (I–K’) Static images and kymographs showing GABAAR vesicle movement through dendrites transfected with GFPGABAARs and either control (I, I’) or HAP1 RNAi (K, K’). Bottom panels show masks of kymographs to allow visualisation of only the moving vesicles.
Figure 7
Figure 7. PolyQ-htt disrupts GABAAR trafficking and reduces synaptic inhibition
(A–C) WT (+/+) or 109Q/109Q neuronal cells expressing α1,β3 and GFPγ2 subunits were used to analyse the trafficking of GFPGABAAR vesicles in real time by video microscopy. (A) Average velocity±s.e.m (µm/sec) of moving vesicles was reduced in 109Q/109Q cells compared to +/+ controls (2001 and 2082 measures respectively, 3 independent experiments). (B) The mean total distance ± s.e.m (µm) each vesicle has moved from its origin is longer in +/+ cells compared to 109Q/109Q cells (40 and 38 tracks respectively, 3 independent experiments) demonstrating a decreased processivity in mutant 109Q cells. (C) The distance from origin vs. the average velocity of each vesicle track was plotted. The main population of GFPGABAAR vesicles in 109Q/109Q cells move more slowly and for shorter distances compared to control WT (+/+) cells. (D–H) Whole-cell recordings of mIPSCs from neurons transfected with either GFPpolyQ-htt or GFPWT-htt control. Cumulative distribution plots show the mIPSC amplitude shifts to lower amplitudes in GFPpolyQ-htt transfected neurons, compared to GFPWT-htt control (D), whilst there is no change in mIPSC frequency (E). Representative traces (F) demonstrating reduction in mIPSC sizes in cells transfected with GFPpolyQ-htt, compared to GFPWT-htt transfected cells. Summary bar graphs (G,H) show the average (mean ± s.e.m.) mIPSC amplitude in neurons transfected with GFPWT-htt or GFPpolyQ-htt, and the percentage (mean ± s.e.m.) reduction in mIPSC amplitude and interval by polyQ-htt compared to WT-htt (n = 6; * P < 0.05). (I,J) GABAAR cluster analysis in neurons expressing GFPWT-htt or GFPpolyQ-htt constructs reveals a reduction in synaptic γ2 clusters (arrowheads) in GFPpolyQ-htt transfected neurons compared to GFPWT-htt control (scale bar = 5µm). Error bars, s.e.m.; n = 5 experiments, 19–20 neurons; **: P < 0.01, (Students t-test).

Similar articles

Cited by

References

    1. Arancibia-Carcamo IL, Kittler JT. Regulation of GABA(A) receptor membrane trafficking and synaptic localization. Pharmacol Ther. 2009;123:17–31. - PubMed
    1. Banker G, Goslin K. Culturing nerve cells. 2nd edn. Massachusetts: The MIT Press; 1998.
    1. Ben-Ari Y, Gaiarsa JL, Tyzio R, Khazipov R. GABA: a pioneer transmitter that excites immature neurons and generates primitive oscillations. Physiol Rev. 2007;87:1215–1284. - PubMed
    1. Bi GQ, Morris RL, Liao G, Alderton JM, Scholey JM, Steinhardt RA. Kinesin- and myosin-driven steps of vesicle recruitment for Ca2+-regulated exocytosis. The Journal of cell biology. 1997;138:999–1008. - PMC - PubMed
    1. Chen G, Kittler JT, Moss SJ, Yan Z. Dopamine D3 receptors regulate GABAA receptor function through a phospho-dependent endocytosis mechanism in nucleus accumbens. J Neurosci. 2006;26:2513–2521. - PMC - PubMed

Publication types

MeSH terms