. 2010 Jan 14;65(1):107-21.
doi: 10.1016/j.neuron.2009.12.005.

Synaptic and network mechanisms of sparse and reliable visual cortical activity during nonclassical receptive field stimulation

Affiliations

Synaptic and network mechanisms of sparse and reliable visual cortical activity during nonclassical receptive field stimulation

Bilal Haider et al. Neuron. .

Abstract

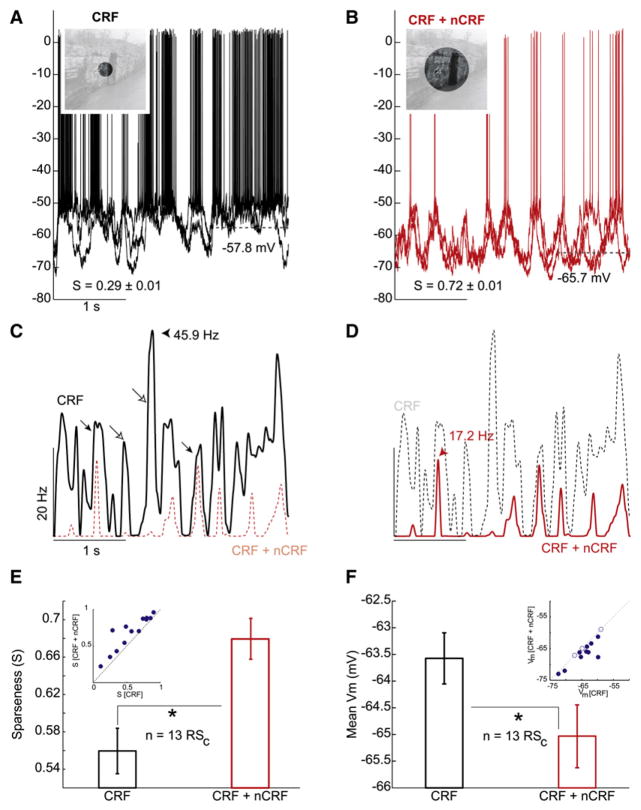
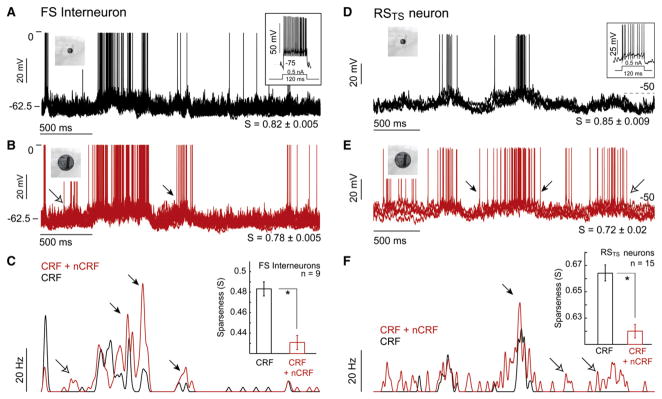
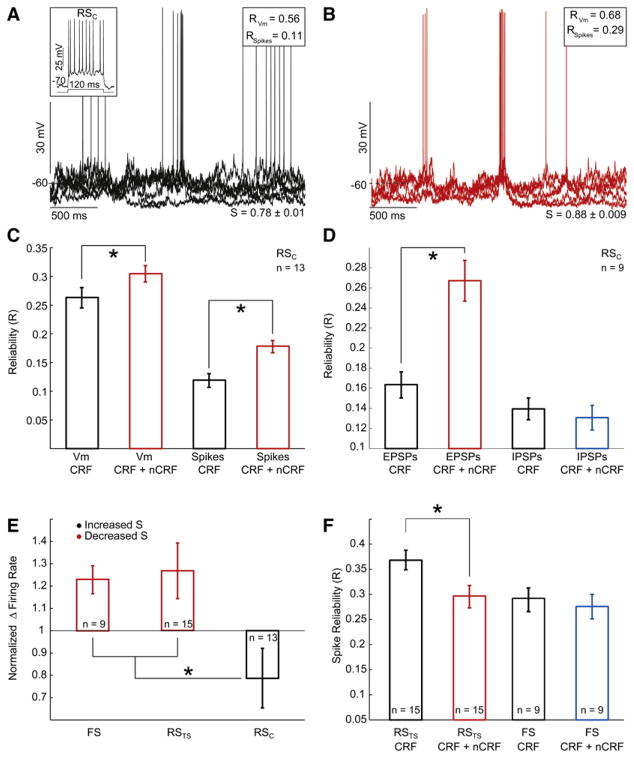
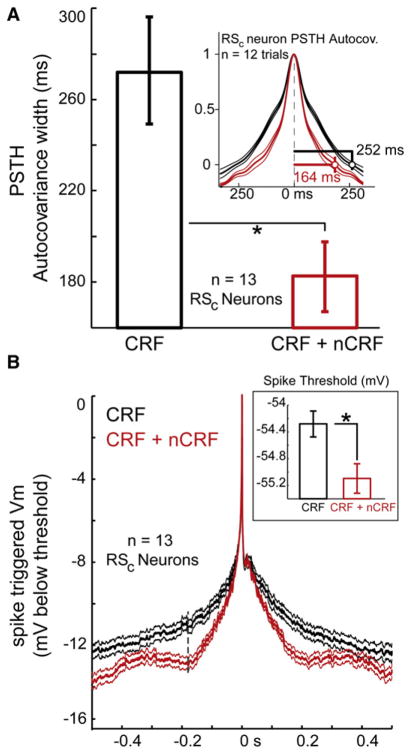
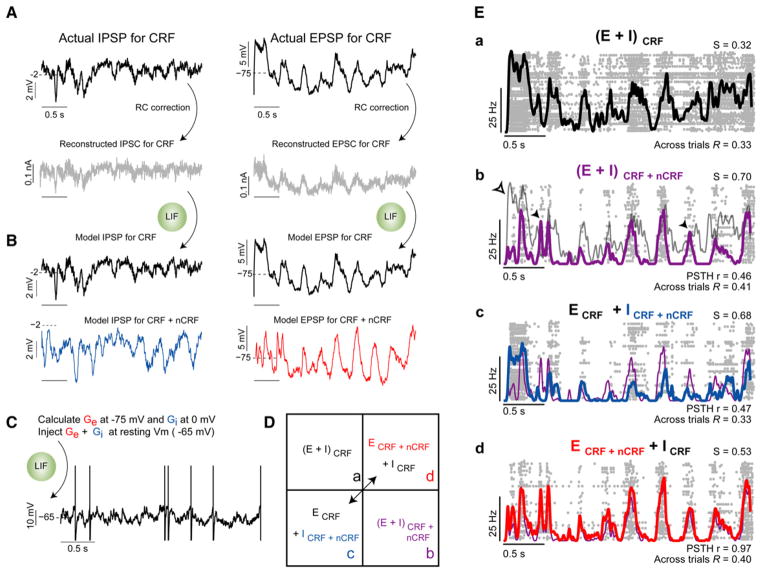
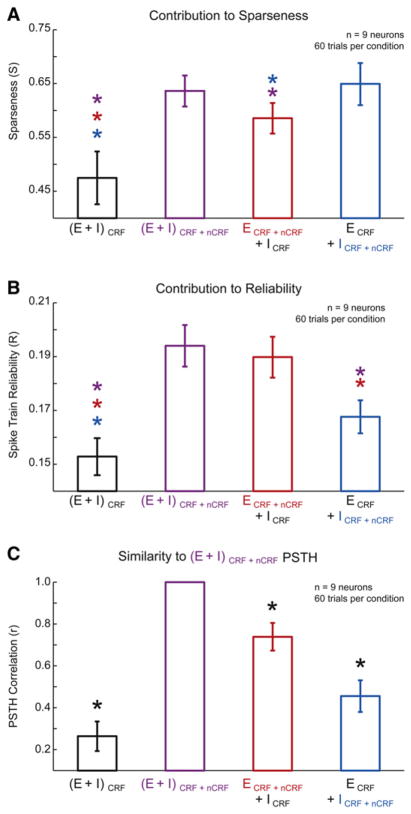
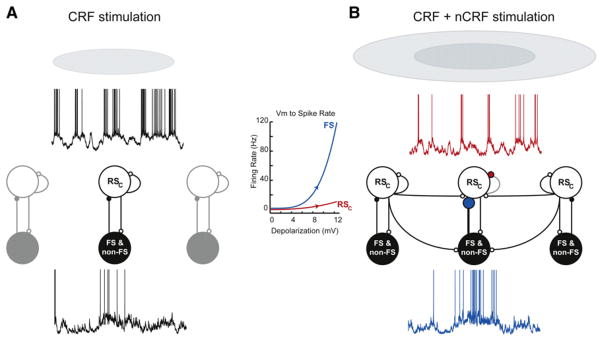
During natural vision, the entire visual field is stimulated by images rich in spatiotemporal structure. Although many visual system studies restrict stimuli to the classical receptive field (CRF), it is known that costimulation of the CRF and the surrounding nonclassical receptive field (nCRF) increases neuronal response sparseness. The cellular and network mechanisms underlying increased response sparseness remain largely unexplored. Here we show that combined CRF + nCRF stimulation increases the sparseness, reliability, and precision of spiking and membrane potential responses in classical regular spiking (RS(C)) pyramidal neurons of cat primary visual cortex. Conversely, fast-spiking interneurons exhibit increased activity and decreased selectivity during CRF + nCRF stimulation. The increased sparseness and reliability of RS(C) neuron spiking is associated with increased inhibitory barrages and narrower visually evoked synaptic potentials. Our experimental observations were replicated with a simple computational model, suggesting that network interactions among neuronal subtypes ultimately sharpen recurrent excitation, producing specific and reliable visual responses.


Figures

Figure 1
Figure 1. Naturalistic Wide-Field Visual Stimulation Increases Selectivity
(A) Intracellular responses of an RSC neuron to repeated presentations (five) of a natural scene movie restricted to the classical receptive field (CRF). Average membrane potential (Vm) = −57.8 mV. Inset shows extent of the movie overlying the CRF; mask was opaque during recordings. The selectivity or sparseness index (S) was 0.29 ± 0.01 (mean and standard error of the mean [± SEM] throughout). (B) Responses to five repeats of the same movie with a larger aperture that stimulated portions of the nonclas-sical receptive field (nCRF) in addition to the CRF. Average Vm = −65.7 mV. Sparseness increased to 0.72 ± 0.01. See also Movie S1. (C and D) Histograms of spiking responses to CRF stimulation (black) and (D) combined CRF + nCRF stimulation (red). Peak CRF response to best frame (45.9 Hz; black arrowhead) occurs 1.4 s after movie onset. Peak CRF + nCRF response (17.2 Hz; red arrowhead) occurs 0.6 s after movie onset. Histograms appear twice (C and D) and are overlaid to facilitate comparison. Note that CRF + nCRF costimulation results in the suppression of some peaks present in the CRF response (open arrows), while others are less affected (closed arrows). See also Figure S1. (E) Spiking responses became significantly more sparse (see text) in all 13 neurons (inset), corresponding to a 23% net increase in sparseness with combined CRF + nCRF stimulation (SCRF + nCRF = 0.69 ± 0.02) compared with CRF alone stimulation (SCRF = 0.56 ± 0.02; p < 0.01) across the population of RSC neurons. See also Tables S1 and S2. (F) Neurons were significantly hyperpolarized (−1.6 mV on average; 10/13 individually, inset) during CRF + nCRF stimulation (Vm CRF + nCRF = −65.3 ± 0.4 mV; Vm CRF =−63.7 ± 0.6 mV; p < 0.01) in comparison to CRF only stimulation.
Figure 2
Figure 2. Wide-Field Visual Stimulation Selectively Increases the Amplitude of Inhibitory Postsynaptic Potentials
(A) Average inhibitory postsynaptic potentials (IPSPs) recorded during 12 presentations of a naturalistic movie to the CRF (black traces) and to the CRF + nCRF (blue). QX-314 and Cs+ in micropipette. Upper and lower thin traces indicate ± SEM. Dashed vertical line indicates movie onset, downward deflections indicate IPSPs. Some IPSP barrages increase greatly (closed arrows), while others change little (open arrows). CRF + nCRF stimulation significantly increases average IPSP amplitude (compared with average response during CRF stimulation) in this cell by −2.73 ± 0.51 mV (p < 0.01; recorded at 0 mV). (B) In contrast to IPSPs, EPSPs (recorded at −75 mV) did not significantly differ in amplitude between the two conditions (−0.41 ± 0.61 mV; p > 0.1). The neuron shown here is the same neuron as shown in Figures 1A and 1B after spike inactivation. (C) Population differences in EPSPs (red) and IPSPs (blue) evoked with CRF + nCRF stimulation, compared with CRF alone stimulation. All nine neurons were determined to be RSC before spike inactivation. CRF + nCRF evoked IPSP barrages were significantly larger on average (blue, −1.99 ± 0.4 mV; 43.7 ± 12.0% increase; p < 0.01) while EPSP barrages were not (0.33 ± 0.2 mV; 4.9 ± 4.3% increase; p > 0.1). Values are mean ± SEM.
Figure 3
Figure 3. Fast-Spiking Interneurons and Thin-Spike Regular-Spiking Neurons Become More Active and Less Sparse during CRF + nCRF Stimulation
(A) Intracellular responses of an electrophysiologically identified FS interneuron (inset, shows sustained firing rate >300 Hz in response to current pulse) during ten trials of CRF stimulation (black). (B) CRF + nCRF stimulation (red) elicits larger responses, compared with the CRF configuration (closed arrows). (C) PSTHs from 15 repeated trials of CRF (black) and CRF + nCRF presentations (red) reveal elevated PSTH peaks (closed arrows), and the appearance of new peaks (open arrow) during wide-field stimulation. FS interneuron population (n = 5 intracellular, n = 4 extracellular) significantly decreased response sparseness (12%) with CRF + nCRF stimulation (SCRF = 0.48 ± 0.007; SCRF + nCRF = 0.43 ± 0.007; p < 0.01). Values are mean ± SEM. (D) Intracellular response of an RSTS neuron (inset, adapting firing pattern to current pulse, rate −100 Hz, spike width at half height 0.25 ms) during five trials of CRF stimulation (black). (E) Response of same neuron to five trials of CRF + nCRF stimulation (red). Note increased action potential response (closed arrows) and addition of new responses (open arrow). (F) PSTH across 15 trials of CRF stimulation (black) and CRF + nCRF stimulation (red) reveals elevated PSTH peaks (closed arrow), along with addition of peaks (open arrows) during wide-field stimulation. Inset, RSTS neuron population (n = 12 intracellular, 3 juxtacellular) significantly decreased sparseness (7% average decrease; SCRF = 0.66 ± 0.006; SCRF + nCRF = 0.62 ± 0.005; p < 0.01) during CRF + nCRF stimulation. See Figure S2 for RSTS neurons, and Table S3 for biophysical and functional response properties of cell classes. Values are mean ± SEM.
Figure 4
Figure 4. Correlated Activity in Subthreshold and Spiking Responses in Distinct Excitatory Networks Drives Increased Reliability of Visual Responses during Wide-Field CRF + nCRF Stimulation
(A) Response of an RSC neuron to five natural movie presentations to the CRF (current pulse response, inset). Note the trial-to-trial variability of membrane potential (Vm) response. (B) Same neuron, responses to five trials of CRF + nCRF movie. Across all 20 trials, there was a 21% increase in the reliability of Vm across trials (inset; RVm = 0.68) and a 163% increase in reliability of spike responses (RSpikes = 0.29) compared with CRF stimulation (inset in 4A; RVm = 0.56; RSpikes = 0.11; p < 0.01 for both comparisons). Sparseness across all trials also significantly increased (p < 0.01). (C) Trial-to-trial membrane potential response reliability of RSC neuron population (n = 13) significantly increases with CRF + nCRF stimulation (Vm RCRF = 0.26 ± 0.01; Vm RCRF + nCRF = 0.31 ± 0.01; p < 0.01) in parallel with increased reliability of spike responses in these same neurons (spikes RCRF = 0.12 ± 0.01; spikes RCRF + nCRF = 0.18 ± 0.01; p < 0.01). Values are mean ± SEM. See also Figure S4 for similar results in MU recordings. (D) Isolated EPSPs significantly increase reliability (by 70%) with CRF + nCRF stimulation (EPSP RCRF = 0.16 ± 0.01; EPSP RCRF + nCRF = 0.27 ± 0.02; p < 0.01), while IPSP reliability does not significantly change (IPSP RCRF = 0.14 ± 0.01; IPSP RCRF + nCRF = 0.13 ± 0.01; p > 0.1). (E) Normalized firing rates of both FS and RSTS neurons increase significantly with CRF + nCRF stimulation (22.8 ± 6.3% and 26.8 ± 12.5%, respectively; p < 0.01, sign test), while normalized firing rates of RSC neurons decrease significantly with CRF + nCRF stimulation (−21.2 ± 13.4%; p < 0.01, sign test). Firing rates normalized to CRF alone average firing rates for each neuron (FS: 7.6 ± 1.8 Hz; RSTS: 2.8 ± 0.7 Hz; RSC: 1.8 ± 1.2 Hz). (F) RSTS neurons significantly decrease their spike-train reliability (black and red, left) with CRF + nCRF stimulation, (RCRF = 0.37 ± 0.02; RCRF + nCRF = 0.30 ± 0.02; p < 0.01) while FS neurons maintain high spike-train reliability (black and blue, right) with CRF + nCRF stimulation, (RCRF = 0.29 ± 0.02; RCRF + nCRF = 0.28 ± 0.02; p > 0.1).
Figure 5
Figure 5. Temporal Precision of Spike Responses in RSC Neurons Increases with CRF + nCRF Stimulation and Is Associated with Narrowing of the Underlying Synaptic Events
(A) Width of the autocovariance function of a representative RSC neuron’s PSTH is significantly (35%) narrower with combined CRF + nCRF stimulation (red) compared with CRF alone stimulation (black). Across the population of RSC neurons (n = 13), there was a significant narrowing (by 33%) of the average event in the PSTH with combined CRF + nCRF stimulation (181.6 ± 15.6 ms, red bar) compared with CRF alone stimulation (272.4 ± 23.9 ms, black bar; p < 0.01). See also Figure S5 for interspike interval histograms. Values are mean ± SEM. (B) Spike-triggered average of Vm in these same neurons reveals a narrower synaptic potential underlying spikes, and more rapid prespike trajectory (from −179 ms to threshold) with CRF + nCRF stimulation compared with CRF alone stimulation (dV/dt CRF = 0.062 ± 0.002 mV/ms; dV/dt CRF + nCRF = 0.073 ± 0.002 mV/ms; p < 0.01). Traces aligned at spike threshold voltage before averaging (0 on ordinate). Inset shows that spike threshold is also significantly lower with wide-field stimulation (Threshold CRF + nCRF = −55.1 ± 0.2 mV; Threshold CRF = −54.2 ± 0.2 mV; p < 0.01). All data for n = 13 RSC neurons (mean ± SEM).
Figure 6
Figure 6. Changes in Excitatory and Inhibitory Synaptic Barrages Drive Increased Sparseness and Reliability with Wide-Field Stimulation in a Leaky Integrate and Fire Model Neuron
(A) Correction for input resistance (Rin) and capacitance (Cm) of the recorded neuron allows inference of synaptic currents (IPSC or EPSC) that underlie an individual IPSP (left) or EPSP (right) amplitude-time series recorded in real neurons during CRF presentation. All traces in this figure were derived from data obtained from the neuron illustrated in Figures 1 and 2. (B) Injection of these IPSC or EPSC traces into a leaky integrate and fire (LIF) model with experimentally measured Rin and Cm reproduces the original recorded IPSP (left) and EPSP (right) trace. Reconstructed example EPSP and IPSP amplitude-time series for CRF + nCRF stimulation shown in blue and red (lower traces). (C) Excitatory and inhibitory conductances (Ge and Gi) derived from the reconstructed currents during CRF stimulation are injected into the LIF model cell at rest (−65 mV). (D) Matrix of Ge and Gi combinations that can be examined in the LIF model. Injection of Ge and Gi from the same conditions (e.g., within CRF or CRF + nCRF stimulation) represents the control conditions (Da and Db). Mixing Ge and Gi obtained from different conditions represents our experimental manipulation (Dc and Dd). (Ea) LIF raster and PSTH in response to 60 simulated (E + I)CRF trials. Sparseness, S = 0.32 ± 0.002, spike-train reliability, RCRF = 0.33 ± 0.02. (Eb) LIF raster and PSTH in response to 60 simulated (E + I)CRF + nCRF trials. Sparseness and spike-train reliability increase significantly (S = 0.70 ± 0.002, spike train RCRF + nCRF = 0.41 ± 0.02; p < 0.01 for both comparisons to CRF simulations). Note nonlinear change in shape of PSTH: some peaks are enhanced (solid arrowheads) while others are suppressed (open arrowhead). Correlation coefficient (r) of PSTH (E + I)CRF to PSTH (E + I)CRF + nCRF = 0.46 ± 0.02. (Ec) LIF raster and PSTH in response to 60 simulated (ECRF + ICRF + nCRF) trials. Sparseness increase significantly (S = 0.68 ± 0.002; p < 0.01) compared with (E + I)CRF. Spike-train reliability decreased significantly in comparison to (E + I)CRF simulations. (ECRF + ICRF + nCRF) R = 0.33 ± 0.02; p < 0.01. Correlation coefficient (r) of PSTH (ECRF + ICRF + nCRF) to PSTH (E + I)CRF + nCRF = 0.47 ± 0.02. (Ed) LIF raster and PSTH in response to 60 simulated (ECRF + nCRF + ICRF) trials. Sparseness increased (S = 0.53 ± 0.002; p < 0.01), although significantly less than in (ECRF + ICRF + nCRF) simulation. However, spike-train reliability increased significantly in comparison to (ECRF + ICRF + nCRF) simulation (p < 0.01), and was not significantly different from (E + I)CRF simulations, (ECRF + nCRF + ICRF) R = 0.40 ± 0.02; p > 0.1. Correlation coefficient of PSTH (ECRF + nCRF + ICRF) to PSTH (E + I)CRF + nCRF = 0.97 ± 0.02, a significant (106%, p < 0.01) increase compared with (ECRF + nCRF + ICRF) simulations.
Figure 7
Figure 7. LIF Simulations Indicate that Network-Generated Inhibition Drives Increased Sparseness, while Network-Generated Excitation Drives Increased Response Reliability
(A) LIF simulations derived from population of real neurons (n = 9; see Figure 2) indicate that spike-train sparseness was significantly lower in the (E + I)CRF + nCRF simulations compared with the three other simulation conditions (S = 0.47 ± 0.04; colored asterisks indicate significant group differences corrected for multiple comparisons). Response sparseness in the ECRF + ICRF + nCRF simulations (blue; S = 0.65 ± 0.04) was not significantly different than the (E + I)CRF + nCRF simulation (violet; S = 0.65 ± 0.03; p > 0.1), but both of these groups displayed significantly larger response sparseness than the ECRF + nCRF + ICRF simulations (red; S = 0.58 ± 0.03; p < 0.01 for both group comparisons). Colored asterisks indicate significant group differences. Values are mean ± SEM. (B) Conversely, trial-to-trial spike-train reliability is highest for the (E + I)CRF + nCRF simulations (violet; R = 0.2 ± 0.007), and these spike trains were not significantly more reliable than those in the ECRF + nCRF + ICRF simulations (red; R = 0.19 ± 0.007; p > 0.1). However, spike responses of both of these groups were significantly more reliable than the spike trains of the ECRF + ICRF + nCRF simulations (blue; R = 0.17 ± 0.006; p < 0.01 for both group comparisons). (C) Summary of LIF simulations shows that overall spiking pattern (PSTH) of ECRF + nCRF + ICRF simulations is the most similar to (E + I)CRF + nCRF PSTH (red; r = 0.74 ± 0.007), although the ECRF + ICRF + nCRF PSTH was significantly more similar to the (E + I)CRF + nCRF PSTH (blue; r = 0.46 ± 0.008), as compared with the similarity of the (E + I)CRF PSTH to the (E + I)CRF + nCRF PSTH (black; r = 0.26 ± 0.007; p < 0.01 for all group comparisons). See also Figure S6 for effects of manipulating timing of Gi relative to Ge.
Figure 8
Figure 8. Schematic Diagram of Proposed Excitatory-Inhibitory Interactions during Wide-Field Visual Stimulation
(A) Local cortical networks composed of excitatory (white) and inhibitory (black) neurons form interconnections with each other, with the great majority of connectivity occurring among excitatory neurons. During CRF stimulation, both excitatory and inhibitory cell types are driven, with RSC neurons and FS neurons generating elevated and temporally varying responses (traces). (B) Upon simultaneous engagement of the CRF and nCRF, inhibitory interneurons become strongly activated by increased excitatory drive arising from a larger spatial distribution of inputs. The increased depolarization and enhanced synaptic fluctuations in interneurons are nonlinearly transformed into greater numbers of spikes compared with excitatory neurons (inset at center). This causes RSC neurons to receive enhanced inhibitory synaptic barrages at specific time points, which leads to increased sparseness and precision of visually evoked spike responses in RSC neurons. These sparser but less variable spikes are amplified through the recurrent excitatory connections among RSC neurons in the local network (red synapse), which leads to more reliable and precise sensory encoding across the ensemble of pyramidal neurons (red trace).

Similar articles

Cited by

References

    1. Anderson JS, Lampl I, Gillespie DC, Ferster D. The contribution of noise to contrast invariance of orientation tuning in cat visual cortex. Science. 2000;290:1968–1972. - PubMed
    1. Anderson JS, Lampl I, Gillespie DC, Ferster D. Membrane potential and conductance changes underlying length tuning of cells in cat primary visual cortex. J Neurosci. 2001;21:2104–2112. - PMC - PubMed
    1. Angelucci A, Bressloff PC. Contribution of feedforward, lateral and feedback connections to the classical receptive field center and extra-classical receptive field surround of primate V1 neurons. Prog Brain Res. 2006;154:93–120. - PubMed
    1. Azouz R, Gray CM. Adaptive coincidence detection and dynamic gain control in visual cortical neurons in vivo. Neuron. 2003;37:513–523. - PubMed
    1. Azouz R, Gray CM, Nowak LG, McCormick DA. Physiological properties of inhibitory interneurons in cat striate cortex. Cereb Cortex. 1997;7:534–545. - PubMed

LinkOut - more resources