

Effects on human plasminogen conformation and activation rate caused by interaction with VEK-30, a peptide derived from the group A streptococcal M-like protein (PAM)
- PMID: 20152941
- PMCID: PMC2846993
- DOI: 10.1016/j.bbapap.2010.01.019
Effects on human plasminogen conformation and activation rate caused by interaction with VEK-30, a peptide derived from the group A streptococcal M-like protein (PAM)
Abstract
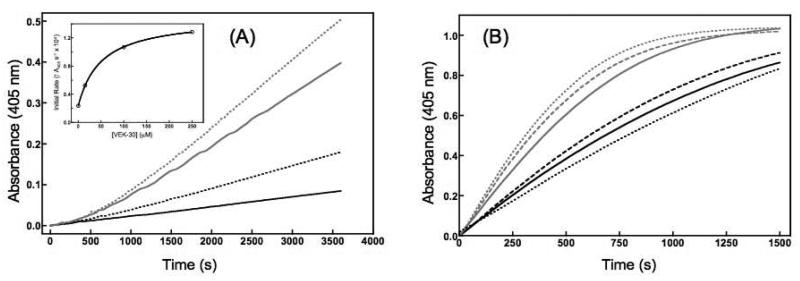
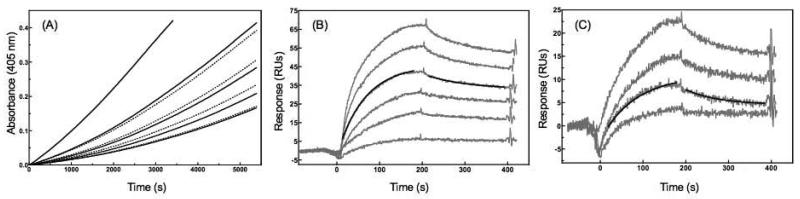
In vertebrates, fibrinolysis is primarily carried out by the serine protease plasmin (Pm), which is derived from activation of the zymogen precursor, plasminogen (Pg). One of the most distinctive features of Pg/Pm is the presence of five homologous kringle (K) domains. These structural elements possess conserved Lys-binding sites (LBS) that facilitate interactions with substrates, activators, inhibitors and receptors. In human Pg (hPg), K2 displays weak Lys affinity, however the LBS of this domain has been implicated in an atypical interaction with the N-terminal region of a bacterial surface protein known as PAM (Pg-binding group A streptococcal M-like protein). A direct correlation has been established between invasiveness of group A streptococci and their ability to bind Pg. It has been previously demonstrated that a 30-residue internal peptide (VEK-30) from the N-terminal region of PAM competitively inhibits binding of the full-length parent protein to Pg. We have attempted to determine the effects of this ligand-protein interaction on the regulation of Pg zymogen activation and conformation. Our results show minimal effects on the sedimentation velocity coefficients (S degrees (20,w)) of Pg when associated to VEK-30 and a direct relationship between the concentration of VEK-30 or PAM and the activation rate of Pg. These results are in contrast with the major conformational changes elicited by small-molecule activators of Pg, and point towards a novel mechanism of Pg activation that may underlie group A streptococcal (GAS) virulence.
Copyright 2010 Elsevier B.V. All rights reserved.
Figures


Similar articles
-
The lack of binding of VEK-30, an internal peptide from the group A streptococcal M-like protein, PAM, to murine plasminogen is due to two amino acid replacements in the plasminogen kringle-2 domain.J Biol Chem. 2008 Jan 18;283(3):1580-1587. doi: 10.1074/jbc.M705063200. Epub 2007 Nov 26. J Biol Chem. 2008. PMID: 18039665
-
Solution structure of the complex of VEK-30 and plasminogen kringle 2.J Struct Biol. 2010 Mar;169(3):349-59. doi: 10.1016/j.jsb.2009.09.011. Epub 2009 Sep 30. J Struct Biol. 2010. PMID: 19800007 Free PMC article.
-
A local α-helix drives structural evolution of streptococcal M-protein affinity for host human plasminogen.Biochem J. 2020 May 15;477(9):1613-1630. doi: 10.1042/BCJ20200197. Biochem J. 2020. PMID: 32270857 Free PMC article.
-
Pathogen activators of plasminogen.J Thromb Haemost. 2015 Jun;13 Suppl 1(0 1):S106-14. doi: 10.1111/jth.12939. J Thromb Haemost. 2015. PMID: 26149011 Free PMC article. Review.
-
The streptococcal M protein: a highly versatile molecule.Trends Microbiol. 2010 Jun;18(6):275-82. doi: 10.1016/j.tim.2010.02.007. Epub 2010 Mar 27. Trends Microbiol. 2010. PMID: 20347595 Review.
Cited by
-
Dimerization is not a determining factor for functional high affinity human plasminogen binding by the group A streptococcal virulence factor PAM and is mediated by specific residues within the PAM a1a2 domain.J Biol Chem. 2014 Aug 1;289(31):21684-93. doi: 10.1074/jbc.M114.570218. Epub 2014 Jun 24. J Biol Chem. 2014. PMID: 24962580 Free PMC article.
-
Structure and Function Characterization of the a1a2 Motifs of Streptococcus pyogenes M Protein in Human Plasminogen Binding.J Mol Biol. 2019 Sep 6;431(19):3804-3813. doi: 10.1016/j.jmb.2019.07.003. Epub 2019 Jul 8. J Mol Biol. 2019. PMID: 31295457 Free PMC article.
-
Conformationally organized lysine isosteres in Streptococcus pyogenes M protein mediate direct high-affinity binding to human plasminogen.J Biol Chem. 2017 Sep 8;292(36):15016-15027. doi: 10.1074/jbc.M117.794198. Epub 2017 Jul 19. J Biol Chem. 2017. PMID: 28724633 Free PMC article.
-
Variable region in streptococcal M-proteins provides stable binding with host fibrinogen for plasminogen-mediated bacterial invasion.J Biol Chem. 2017 Apr 21;292(16):6775-6785. doi: 10.1074/jbc.M116.768937. Epub 2017 Mar 9. J Biol Chem. 2017. PMID: 28280245 Free PMC article.
References
-
- Berge A, Sjobring U. PAM, a novel plasminogen-binding protein from Streptococcus pyogenes. J. Biol. Chem. 1993;268:25417–25424. - PubMed
-
- Ploplis VA, Castellino FJ. Nonfibrinolytic functions of plasminogen. Methods. 2000;21:103–110. - PubMed
-
- Walker MJ, McArthur JD, McKay F, Ranson M. Is plasminogen deployed as a Streptococcus pyogenes virulence factor? Trends Microbiol. 2005;13:308–313. - PubMed
-
- Carapetis JR, Steer AC, Mulholland EK, Weber M. The global burden of group A streptococcal diseases. Lancet Infect. Dis. 2005;5:685–694. - PubMed
-
- Ringdahl U, Sjobring U. Analysis of plasminogen-binding M proteins of Streptococcus pyogenes. Methods. 2000;21:143–150. - PubMed
Publication types
MeSH terms
Substances
Grants and funding
LinkOut - more resources
Full Text Sources
Miscellaneous
