Review
. 2010 Apr;33(4):183-92.
doi: 10.1016/j.tins.2010.01.003. Epub 2010 Feb 10.

Learning to see: patterned visual activity and the development of visual function

Affiliations
Review

Learning to see: patterned visual activity and the development of visual function

Edward S Ruthazer et al. Trends Neurosci. 2010 Apr.

Abstract

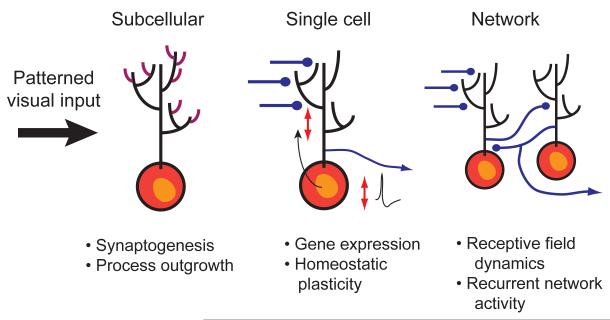
To successfully interact with their environments, developing organisms need to correctly process sensory information and generate motor outputs appropriate to their size and structure. Patterned sensory experience has long been known to induce various forms of developmental plasticity that ultimately shape mature neural circuits. These same types of plasticity also allow developing organisms to respond appropriately to the external world by dynamically adapting neural circuit function to ongoing changes in brain circuitry and sensory input. Recent work on the visual systems of frogs and fish has provided an unprecedented view into how visual experience dynamically affects circuit function at many levels, ranging from gene expression to network function, ultimately leading to system-wide functional adaptations.


Figures

Figure 1
Figure 1. Rapid functional modulation of the retinotectal circuit by visual experience
Although neural activity is known to be critical for the gradual sculpting of neural circuits over development, there is ample evidence that patterned activity also induces rapid functional adaptations which may allow for the optimization of neural circuit function in response to a changing environment and neuronal architecture. In this article we review recent studies from the visual system of frogs and fish that show that these adaptations can occur at many levels of function in the optic tectum, the principal visual area in the brains of these species. (A) On the subcellular scale visual activity can induce rapid changes in optic tectal neurons which involve synaptogenesis and process outgrowth. This provides a substrate for rapid experience-dpendent plasticity. (b) At the single cell level visual experience triggers gene expression which can have cell-wide effects, particularly in altering dendritic structure. It can also allow homoestatic adaptations in synaptic transmission and intrinsic excitability which can normalize the input-output properties of tectal neurons. (C) At the level of neural circuits, visual experience can modify receptive field properties of tectal neurons as well as the temporal activation pattern of recurrent circuits within the tectum.
Figure 2
Figure 2. Activity-dependent regulation of gene transcription by NFAT alters dendritic and synaptic development
In Xenopus tadpoles, visual stimulation causes the transcriptional regulator NFAT to translocate toward the nucleus where it drives changes in the expression levels of a number of plasticity-associated gene products. (A) Expression of NFAT tagged with EGFP (green) in tectal neurons, co-expressing cell-filling tdTomato to visualize dendritic morphology, reveals an increase in NFAT-GFP fluorescence in the cell soma and nucleus with a concommitant decrease in dendritic intensity following 40min of continuous visual stimulation. (B) The nuclear translocation of NFAT-GFP in response to visual stimulation requires synaptic activation of NMDA receptors. Blocking NMDA receptors prevents this translocation, even causing a decrease in nuclear NFAT-GFP levels, suggesting that basal synaptic transmission may be sufficient to drive an intermediate level of NFAT activation. (C-E) These data suggest that dendritic stores of NFAT, perhaps associated with synapses, translocate to the nucleus in response to NMDAR activation. At the nucleus NFAT regulates expression levels of gene products that control both dendritic branching and synaptogenesis or synapse maturation. Blocking NFAT activation increases both branching and mEPSC frequency. Data adapted from Schwartz et al., 2009.
Figure 3
Figure 3. Homeostatic regulation of synaptic transmission and intrinsic excitability in Xenopus tadpole tectal neurons
Tectal cells are known to adjust their intrinsic excitability in order to maintain a broad dynamic range in response to changes in levels of synaptic input. Both short periods of patterned visual input as well as overall activity levels during development can trigger these changes, which are expressed as changes in voltage-gated Na+ currents. In (A), freely-swimming tadpoles were exposed to 4 hours of enhanced, patterned visual stimulation. This resulted in an overall decrease in spontaneous excitatory synaptic transmission caused by enhanced blockade of Ca++-permeable AMPA receptors by polyamines. As a consequence of this decrease, the amplitude of voltage-gated Na+ currents was enhanced, increasing the intrinsic excitability of tectal cells. This combination of synaptic and intrinsic changes allows tectal cells to filter out noisy background stimuli, while enhancing stimulus sensitivity to more salient visual stimuli. In (B), the relationship between background spontaneous excitatory synaptic input and voltage-gated Na+ currents was measured over development. Between developmental stages 45 and 49, tectal neurons undergo a period of rapid growth and synaptic maturation. Starting from stage 45 tectal neurons show enhanced excitability and low levels of background excitatory synaptic input. By stage 49, the amount of synaptic input dramatically increases. This results in a homeostatic downregulation of voltage-gated Na+ currents, resulting in decreased intrinsic excitability. Both of these example illustrate how tectal neurons can dynamically adapt their intrinsic properties in response to changes in overall levels of synaptic drive. Figure based on findings from Aizenman et al. 2002, 2003 and Pratt et al. 2007.
Figure 4
Figure 4. Patterned visual activity can dynamically alter the spatial properties of tectal neuron receptive fields
While visual activity-induced synaptic plasticity has been long believed to play a role in refinement of retinotopic maps, this same type of plasticity can also rapidly alter the functional response properties of visual neurons, including retinotopy. In this example Engert and colleagues use a spike-timing dependent plasticity (STDP) protocol to alter the spatial location of tectal cell receptive fields in Xenopus tadpoles. (A) Training protocol for inducing (STDP) of receptive field location. After rapidly mapping the receptive field of a tectal neuron from which whole-cell recordings are being performed, either a positive or a negative training protocol was administered. In the positive training, an area of visual space on the edge of the receptive field was activated to induce a visual stimulus. In the diagram the receptive field is indicated by the gray circle and the training area by the dotted circle. A few milliseconds after the visual input activated the tectal cell, the cell was briefly depolarized to generate an action potential. Based on a STDP rule where the visual input (V) occurs before the spike (S), this would result in potentiation of the visual inputs on the edge of the receptive field, and would eventually cause a shift of the receptive field center towards the training area. In the negative training protocol, the neuron is made to spike a few milliseconds before the visual input arrives (S before V). This would result in depression of the visual input and a shift in the receptive field center away from the training area. (B) Representative data showing the results of positive and negative conditioning. The black blob is the map of the visual receptive field. The darker dotted areas represent the training areas. The white circle is the original receptive field center and the star represents the receptive field center during and after conditioning. Notice the shift of the receptive field center towards or away from the positively or negatively trained areas, respectively. Data adapted from Vislay-Meltzer, 2006.

Similar articles

Cited by

References

    1. Ruthazer ES. You’re perfect, now change--redefining the role of developmental plasticity. Neuron. 2005;45:825–828. - PubMed
    1. Katz LC, Shatz CJ. Synaptic activity and the construction of cortical circuits. Science. 1996;274:1133–1138. - PubMed
    1. Wiesel TN, Hubel DH. Single-Cell Responses in Striate Cortex of Kittens Deprived of Vision in One Eye. J Neurophysiol. 1963;26:1003–1017. - PubMed
    1. Cang J, et al. Development of Precise Maps in Visual Cortex Requires Patterned Spontaneous Activity in the Retina. Neuron. 2005;48:797–809. - PMC - PubMed
    1. Hooks BM, Chen C. Distinct roles for spontaneous and visual activity in remodeling of the retinogeniculate synapse. Neuron. 2006;52:281–291. - PubMed

Publication types

MeSH terms