. 2010 May 5;167(2):510-27.
doi: 10.1016/j.neuroscience.2010.02.012. Epub 2010 Feb 12.

Sensory afferent and hypoxia-mediated activation of nucleus tractus solitarius neurons that project to the rostral ventrolateral medulla

Affiliations

Sensory afferent and hypoxia-mediated activation of nucleus tractus solitarius neurons that project to the rostral ventrolateral medulla

D D Kline et al. Neuroscience. .

Abstract

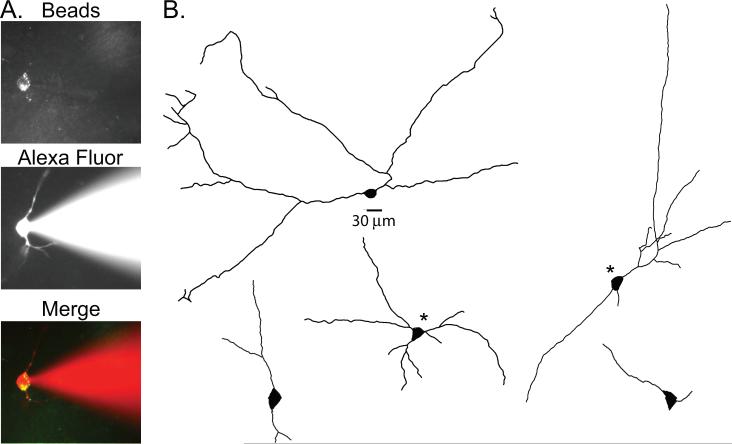
The nucleus tractus solitarius (nTS) of the brainstem receives sensory afferent inputs, processes that information, and sends projections to a variety of brain regions responsible for influencing autonomic and respiratory output. The nTS sends direct projections to the rostral ventrolateral medulla (RVLM), an area important for cardiorespiratory reflexes and homeostasis. Since the net reflex effect of nTS processing ultimately depends on the properties of output neurons, we determined the characteristics of these RVLM-projecting nTS neurons using electrophysiological and immunohistochemical techniques. RVLM-projecting nTS neurons were identified by retrograde tracers. Patch clamp analysis in the horizontal brainstem nTS slice demonstrated that RVLM-projecting nTS cells exhibit constant latency solitary tract evoked excitatory postsynaptic currents (EPSCs), suggesting they receive strong monosynaptic contacts from visceral afferents. Three distinct patterns of action potential firing, associated with different underlying potassium currents, were observed in RVLM-projecting cells. Following activation of the chemoreflex in conscious animals by 3 h of acute hypoxia, 11.2+/-1.9% of the RVLM-projecting nTS neurons were activated, as indicated by positive Fos-immunoreactivity. Very few RVLM-projecting nTS cells were catecholaminergic. Taken together, these data suggest that RVLM projecting nTS neurons receive strong monosynaptic inputs from sensory afferents and a subpopulation participates in the chemoreflex pathway.


Figures

Figure 1
Figure 1. Injection sites for retrograde label into the RVLM
Brightfield (A) and epifluorescent (B) photomicrographs of the same section showing an example, in the coronal plane, of an RVLM microinjection of Fluoro-Gold (FG). Arrow indicates the center of the injection site. C) Location of FG injection sites in animals with coronal tissue sections. Numbers indicate level (mm caudal) relative to Bregma. Brightfield (D) and epifluorescent (E) photomicrographs of the same section showing an example, in the horizontal plane, of an RVLM microinjection of FG. Arrow indicates the center of the injection site. F) Location of FG injection sites in animals with horizontal tissue sections. Upper right number indicates level (mm ventral) relative to Bregma. 7, Facial nucleus; IO, inferior olive; PY, pyramidal tract; nA, nucleus Ambiguus. Open circles, injection sites in normoxic animals; filled circles, injection sites in hypoxic animals.
Figure 2
Figure 2. Synaptic properties of RVLM-projecting nTS cells
A. Composite images of the horizontal nTS slice viewed under DIC (left) and DIC + epifluorescence (green, middle). mnTS, medial nTS; comnTS, commissural nTS. Right panel, identification of a Retrobead labeled cell in the nTS permitted placement of the patch electrode on the RVLM projecting cell. B. Representative example from a projecting cell of a TS evoked EPSC which was sensitive to CNQX (10 μM). C. TS evoked EPSCs were monosynaptically connected to afferent fibers. Left panel, superimposed current traces from a representative cell illustrating consistent EPSC latency (i.e., minimal jitter) which is indicative of a monosynaptic cell. Right panel, amplitude versus jitter distribution plot. Asterisk by symbol is likely a polysynaptic cell. D. Quantitative data for an EPSC train (20 Hz) are plotted as raw EPSC amplitude (left axis, closed diamonds) and change from the first EPSC (right axis, open squares) relative to EPSC within the train of events. TS-EPSCs reduced amplitude to 50% of maximum within the first three events. Inset, representative example of a train of TS-evoked EPSCs illustrating frequency dependent depression.
Figure 3
Figure 3. Active membrane properties of RVLM-projecting nTS cells
Tonic (A), Delayed Excitation (DE, B) and Phasic (C) spiking neurons were observed in RVLM-projecting nTS cells. Representative examples are shown in A-C and insets illustrate recording protocol. Panels 1-3 for representative examples are from the same cell. Tonic cells immediately increased APD to a +60 pA current injection (A1) from a holding potential of −60 mV. Prior hyperpolarization did not alter firing properties of tonic spiking cells (A2). In the example shown, the initiation of discharge did not change whether the cell was held at −60 mV (grey line, arrow, number 1) or first hyperpolarized to −70 mV (black line, arrow, number 2). Delayed Excitation cells (B1) exhibited APD to a +60 pA current injection (−60 mV holding) only after an initial delay. Prior hyperpolarization to −70 mV (B2, black line, arrow, number 2) resulted in a greater delay in excitation. Phasic cells discharged 1-4 action potentials during sustained depolarization (+60 pA injection, from −60 mV, C1). Prior hyperpolarization to −70 mV produced variable effects on spike initiation. C2 illustrates the response in one cell. Potassium currents in the three cell spiking types are illustrated in A3-C3. Tonic cells did not exhibit prominent transient outward potassium currents (A3), whereas delayed excitation cells did (B3). Phasic cells had variable outward currents; C3 shows the currents in an individual phasic cell. D) Mean data illustrating number of action potentials evoked to incremental current injection. There was a progressive increase in APD with current injection in Tonic cells, but not DE cells. Tonic cells exhibited greater discharge compared to DE cells at 40 and 60 pA injection. E.) Summary of action potential delay to hyperpolarization in Tonic and DE cells. There was a progressive increase in delay to APD with hyperpolarization in DE cells, but not Tonic cells. F) Transient outward currents in DE and Tonic cells in response to depolarizing potentials. Note the larger transient currents in DE cells at more positive voltages. *, p < 0.05 between Tonic and DE cells.
Figure 4
Figure 4. Morphology of RVLM-projecting nTS neurons
Left: Example of an identified RVLM-projecting nTS neuron containing Retrobeads from the RVLM (top panel), with a patch pipette containing Alexa Fluor 594 Hydrazide dye attached (middle panel); Alexa dye can be seen filling the cell; overlay of the images showing that the cell being recorded contained Retrobeads (bottom panel). Right: Morphology of five Alexa Fluor filled RVLM-projecting neurons that were bipolar and multipolar. * indicates multipolar cells.
Figure 5
Figure 5. RVLM-projecting nTS neurons exhibit Fos-IR in response to hypoxia
A. Example of FG retrograde labeling (grey scale) from the RVLM in a coronal section of the dorsal medulla in an individual rat. B. Merged photomicrographs from the same coronal section as in A showing FG (pseudocolored blue), Fos-IR (pseudocolored red) and TH-IR (pseudocolored green). C. Higher magnification of boxed region in B. Note colabeling of FG and Fos-IR (arrowhead) and Fos-IR and TH-IR (double arrowhead) but not FG and TH-IR. D. Single 1.0 μm confocal section demonstrating Fos (left panel) and FG-labeling (middle panel) in an individual cell. Right panel is a merged image demonstrating the presence of Fos colabeled with the FG cell. E. Example of FG retrograde labeling (grey scale) from the RVLM in a horizontal section through the dorsal medulla in an individual rat. F. Merged photomicrographs from the same horizontal section as in E showing FG (pseudocolored blue), Fos-IR (pseudocolored red) and TH-IR (pseudocolored green). G. Higher magnification of boxed region in F. Note colabeling of FG and Fos-IR (arrowhead) and Fos-IR and TH-IR (double arrowhead) but not FG and TH-IR. H. Single 1.0 μm confocal section illustrating Fos (left panel) and TH (middle panel) in an individual cell. Right panel is a merged image demonstrating Fos colabeled with TH. 4V, Fourth ventricle; AP, area postrema; CC, central canal; TS, tractus solitarius.
Figure 6
Figure 6. Distribution of RVLM projecting neurons and hypoxia-induced Fos immunolabeling in nTS in the coronal plane
Diagrammatic representation of the distribution in an individual hypoxia-exposed rat of RVLM-projecting (FG, top row), Fos-IR (middle row) and RVLM-projecting + Fos-IR neurons (bottom row) at three different caudal to rostral levels within the nTS. Caudal-rostral levels shown relative to calamus scriptorius (0 in A). B) Caudal-rostral distribution of labeling; Left axis: Number of FG-labeled neurons in the nTS (open squares); Right axis: % of FG labeled nTS neurons in acutely hypoxic rats that are colabeled with Fos-IR (black squares) or TH-IR (grey squares). a, p < 0.05 from −720 μm; †, sustained increase from −720 μm; ††, further increase from −360 μm. C) Caudal-rostral distribution of labeling in acutely hypoxic rats; Left axis: Number of Fos-IR neurons in the nTS (open circles). Right axis: % of Fos-IR nTS neurons that are colabeled with FG (black circles) or TH-IR (grey circles). a, p < 0.05 from −720, −360 and −180 μm; †, sustained increase rostrally.
Figure 7
Figure 7. Distribution of RVLM projecting neurons and hypoxia-induced Fos immunolabeling in nTS in the horizontal plane
Diagrammatic representation of the distribution in an individual hypoxia-exposed rat of RVLM-projecting (top row), Fos-IR (middle row) and RVLM-projecting + Fos-IR neurons (bottom row) at three different dorsal-ventral levels within the nTS. Dorsal-ventral levels shown relative to the ventral aspect of the area postrema (0 in A). AP, area postrema; 4V, Fourth ventricle; TS, tractus solitarius. B) Dorsal-ventral distribution; Left axis: Number of FG-labeled neurons in the nTS (open squares); Right axis: % of FG labeled nTS neurons in acutely hypoxic rats that are colabeled with Fos-IR (black squares) or TH-IR (grey squares). †, sustained increase from +180 μm. C) Dorsal-ventral distribution of labeling in acutely hypoxic rats; Left axis: Number of Fos-IR neurons in the nTS (open circles); Right axis: % of Fos-IR nTS neurons after acute hypoxia that are colabeled with FG (black circles) or TH-IR (grey circles). †, different from +180 μm with no further change ventrally.
Figure 8
Figure 8. Acute hypoxia increases Fos-IR in the nTS
Representative photomicrographs, in the coronal (A and B) or horizontal (D and E) plane, from individual animals exposed to three hours of normoxia or hypoxia (10% O2). C & F) The number of Fos-IR nTS neurons per section following exposure to three hours of normoxia or hypoxia (C; coronal: n = 3 each; F: horizontal: n = 4 each). 4V, Fourth ventricle; AP, area postrema; cc, central canal; nTS, nucleus tractus solitarius; TS, tractus solitarius.
Figure 9
Figure 9. RVLM-projecting cells which are activated by hypoxia receive input from carotid body afferents
Representative photomicrographs from anterograde carotid body labeled and RVLM-projecting nTS cells. A) Image of RVLM-projecting nTS cell observed in the live in vitro brainstem slice that has closely apposed DiI-labeled carotid body terminals (arrow). Inset, image demonstrating placement of patch pipette on dual labeled cells for recording of EPSCs. B. & C) Spinning disk confocal images of RVLM-projecting nTS cells which exhibit Fos-IR in response to hypoxia and also possess closely apposed CtB-labeled carotid body terminals (arrows). B) Z-projection of 7 separate 0.1 μm slices taken with a confocal spinning disk microscope (final image is 0.7 μm). C) Single 0.5 μm confocal section. Inset in C, zoomed single slice image of asterisk labeled terminal demonstrating close apposition of terminal to FG cell. Scale in inset, 1 μm. Fos-IR is pseudocolored blue, Retrobeads (panel A) and FG (panel B and C) are pseudocolored green, DiI (panel A) and CtB (Panels B & C) are pseudocolored red.

Similar articles

Cited by

References

    1. Aicher SA, Saravay RH, Cravo SL, Jeske I, Morrison SF, Reis DJ, Milner TA. Monosynaptic projections from the nucleus tractus solitarii to C1 adrenergic neurons in the rostral ventrolateral medulla: comparison with input from the caudal ventrolateral medulla. J Comp Neurol. 1996;373:62–75. - PubMed
    1. Andresen MC, Kunze DL. Nucleus tractus solitarius - gateway to neural circulatory control. Annu Rev Physiol. 1994;56:93–116. - PubMed
    1. Austgen JR, Fong AY, Foley CM, Mueller PJ, Kline DD, Heesch CM, Hasser EM. Expression of group I metabotropic glutamate receptors on phenotypically different cells within the nucleus of the solitary tract in the rat. Neuroscience. 2008;159:701–716. - PMC - PubMed
    1. Aylwin ML, Horowitz JM, Bonham AC. NMDA receptors contribute to primary visceral afferent transmission in the nucleus of the solitary tract. J Neurophysiol. 1997;77:2539–2547. - PubMed
    1. Bailey TW, Hermes SM, Andresen MC, Aicher SA. Cranial visceral afferent pathways through the nucleus of the solitary tract to caudal ventrolateral medulla or paraventricular hypothalamus: target-specific synaptic reliability and convergence patterns. J Neurosci. 2006;26:11893–1902. - PMC - PubMed

Publication types

MeSH terms