. 2010 Apr 23;285(17):12862-72.
doi: 10.1074/jbc.M109.030270. Epub 2010 Feb 12.

Self-assembly of severe acute respiratory syndrome coronavirus membrane protein

Affiliations

Self-assembly of severe acute respiratory syndrome coronavirus membrane protein

Ying-Tzu Tseng et al. J Biol Chem. .

Abstract

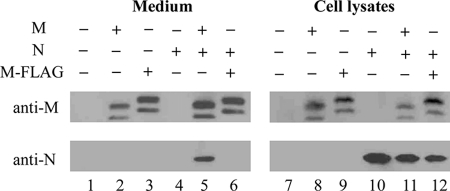
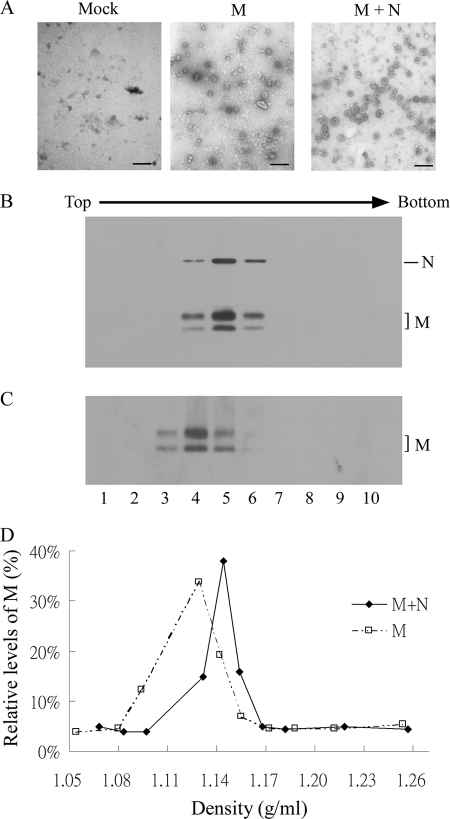
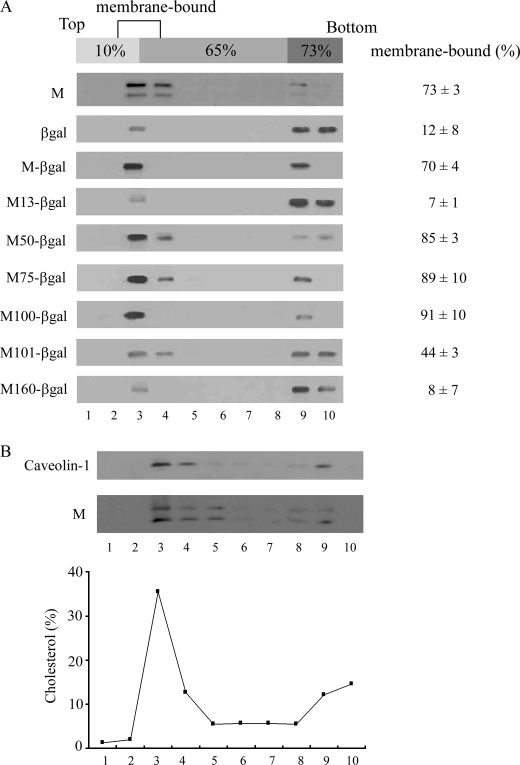
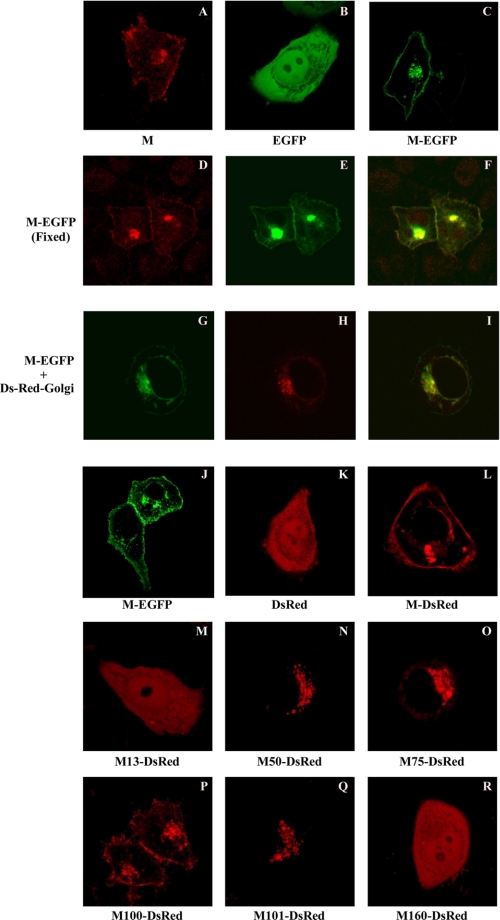
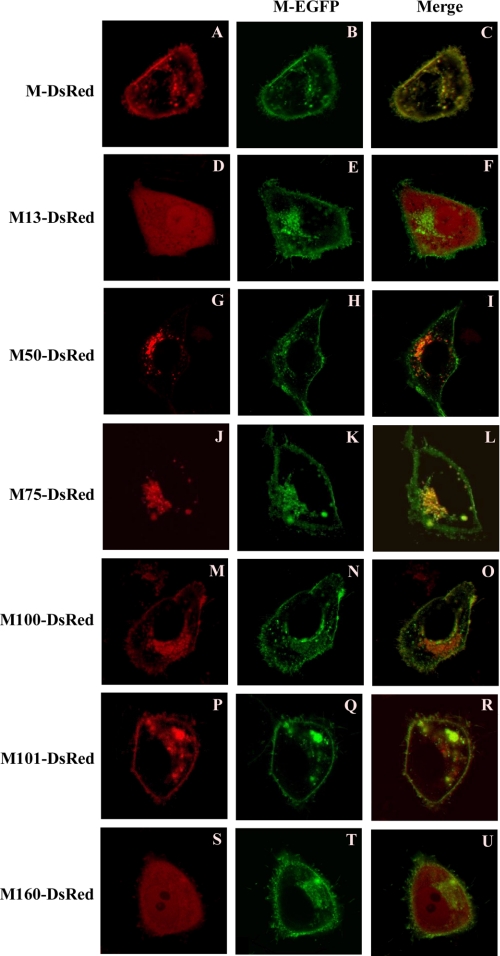
Coronavirus membrane (M) protein can form virus-like particles (VLPs) when coexpressed with nucleocapsid (N) or envelope (E) proteins, suggesting a pivotal role for M in virion assembly. Here we demonstrate the self-assembly and release of severe acute respiratory syndrome coronavirus (SARS-CoV) M protein in medium in the form of membrane-enveloped vesicles with densities lower than those of VLPs formed by M plus N. Although efficient N-N interactions require the presence of RNA, we found that M-M interactions were RNA-independent. SARS-CoV M was observed in both the Golgi area and plasma membranes of a variety of cells. Blocking M glycosylation does not appear to significantly affect M plasma membrane labeling intensity, M-containing vesicle release, or VLP formation. Results from a genetic analysis indicate involvement of the third transmembrane domain of M in plasma membrane-targeting signal. Fusion proteins containing M amino-terminal 50 residues encompassing the first transmembrane domain were found to be sufficient for membrane binding, multimerization, and Golgi retention. Surprisingly, we found that fusion proteins lacking all three transmembrane domains were still capable of membrane binding, Golgi retention, and interacting with M. The data suggest that multiple SARS-CoV M regions are involved in M self-assembly and subcellular localization.


Figures

FIGURE 1.
FIGURE 1.
Assembly and release of SARS-CoV VLPs. 293T cells were transfected with SARS-CoV M, SARS-CoV N, or SARS-CoV M bearing a carboxyl-terminal-tagged FLAG (M-FLAG) expression vector individually or in various combinations. At 48 h post-transfection, supernatants and cells were collected and prepared for protein analysis as described under “Materials and Methods.” Medium pellet samples (lanes 1–6) corresponding to 50% of total and cell lysate samples (lanes 7–12) corresponding to 5% of total were fractionated by 10% SDS-PAGE and electroblotted onto nitrocellulose filters. SARS-CoV M and M-FLAG were probed with rabbit antiserum and SARS-CoV N was detected with a mouse anti-N monoclonal antibody.
FIGURE 2.
FIGURE 2.
SARS-CoV VLP analysis. 293T cells were transfected with M or cotransfected with M and N expression vectors. At 48 h post-transfection, culture supernatants were collected, filtered, and pelleted through 20% sucrose cushions. Pellets were resuspended in PBS buffer, stained, and observed with a TEM (A). Bars, 200 nm. For buoyant density gradient analysis, concentrated supernatants derived from M (C) or M plus N (B) transfection samples were centrifuged through a 10–40% iodixanol gradient for 16 h. Ten fractions (equal quantities) were collected from top to bottom. Fraction densities were measured and SARS-CoV M and N proteins analyzed by Western immunoblotting probed with anti-M and anti-N antibodies. M proteins in each fraction were quantified by scanning immunoblot band densities. Relative M protein level in each fraction was plotted against the iodixanol density (D).
FIGURE 3.
FIGURE 3.
Effects of MβCD or RNase A treatment on M release and M-M or M-N interaction. A and B, 293T cells were transfected with a replication-defective HIV-1 vector, HIVgpt (B) or cotransfected with SARS-CoV M and SARS-CoV N (A). At 18 h post-transfection, transfectants were split equally onto three dish plates, which were left untreated or treated with 5 or 20 mm of MβCD at 37 °C for 30 min. Cells then were washed twice with PBS and refed with medium. At 2 h post-medium replacement, cells and supernatant were harvested for Western immunoblot analysis. HIV-1 capsid proteins were detected with an anti-p24gag monoclonal antibody. Positions of HIV-1 Gag proteins Pr55, p41, and p24 are indicated. C, buoyant density gradient analysis of M particles released from MβCD-treated cells. Supernatants from SARS-CoV M-expressing 293T cells that were untreated or treated with MβCD (20 mm) as described above were collected, filtered, and pelleted through 20% sucrose cushions. Pellets were resuspended in PBS and centrifuged with M-FLAG pellets through the same iodixanol gradient as described in the Fig. 2 legend. Each fraction was measured for density and analyzed for M and M-FLAG protein level by immunoblotting. Asterisks indicate the M-FLAG position. D–F, 293T cells were cotransfected with the designated plasmids. The construct hA3G is an HA-tagged human APOBEC3G expression vector. At 48 h post-transfection, equal amounts of the cell lysates were treated with or without 0.2 mg/ml DNase-free RNase A for 30 min at 25 °C, followed by mixing with glutathione-agarose beads, anti-FLAG, or anti-HA affinity gel. Complexes bound to the beads were pelleted, washed, and subjected to Western immunoblotting. The bands (with an asterisk indicating the N position) in the bottom panels of F are the result of the incomplete stripping of the previous anti-N probe.
FIGURE 4.
FIGURE 4.
SARS-CoV M association with M-βgal fusion proteins. A and B, incorporation of M-βgal into M particles. 293T cells were transfected with M or M-βgal expression vector alone or in combination (B). Two days after transfection, supernatants were collected and pelleted through 20% sucrose cushions. Pellets were resuspended in PBS buffer and centrifuged through 10–40% iodixanol gradients as described in the Fig. 2 legend. To make direct comparison with M particles, M-βgal pellets were pooled with M pellets and centrifuged through the same gradient (A). Each fraction was measured for density and analyzed for M and M-βgal protein level by immunoblotting. C, schematic representations of SARS-CoV M deletion mutations. Indicated is wild-type (WT) SARS-CoV M protein with the three predicted transmembrane domains (shaded boxes). Carboxyl- or amino-terminal residue positions in the deleted mutations were used to designate the constructs (deleted condons are in parentheses). Dashed lines indicate deleted sequences. Each construct was carboxyl-terminally tagged with a β-galactosidase or DsRed coding sequence. D, coimmunoprecipitation of M-βgal fusion proteins with M-FLAG. 293T cells were cotransfected with M-FLAG and pBlueScript SK or M-βgal fusion construct as indicated. Cell lysates were subjected to Western immunoblotting 48 h post-transfection. Equal amounts of cell lysates were mixed with anti-FLAG affinity gel for 2 h at 4 °C. Bead-bound complexes were pelleted, washed, and subjected to Western immunoblotting.
FIGURE 5.
FIGURE 5.
Membrane flotation centrifugation of SARS-CoV M-βgal fusion proteins. A, 293T cells were transfected with the SARS-CoV M, β-gal, or M-βgal expression vectors as indicated. At 2 d post-transfection, cells were harvested and homogenized. Crude membranes extracted from cell lysates were subjected to equilibrium flotation centrifugation as described under “Materials and Methods.” Ten fractions were collected from the top downwards, and fraction aliquots were analyzed by Western immunoblotting. During ultracentrifugation, membrane-bound proteins floated to the 10–65% sucrose interface. Total M or β-gal-associated proteins were quantified by scanning the immunoblot band densities of the 10 fractions. Percentages of membrane-bound proteins were determined by dividing membrane-bound protein density units (fractions 2–4) by total protein density units and multiplying by 100. Mean and standard deviation values for membrane-bound M or β-gal-associated proteins are indicated. B, 293T cells transfected with SARS-CoV M expression vector were subjected to membrane flotation centrifugation as described above. Fraction aliquots were analyzed by Western immunoblotting and measured for cholesterol level as described under “Materials and Methods.” M and caveolin-1 were probed with anti-M and anti-caveolin-1 antibodies.
FIGURE 6.
FIGURE 6.
Subcellular localization of SARS-CoV M (untagged or tagged with a fluorescent protein) in fixed or living cells. HeLa (A–F and K–R), 293T (G–I), or Vero-E6 (J) cells were transfected or cotransfected with the indicated expression vectors. pM-EGFP and pM-DsRed encode SARS-CoV M bearing carboxyl-terminal-tagged EGFP and DsRed, respectively. pDs-Red-Golgi encodes a Golgi apparatus labeling marker. At 4 h (G–I) or 24 h post-transfection, cells were either fixed or directly observed using a laser confocal microscope. Fixed cells (A and D–F) were labeled with a primary anti-SARS-CoV M antibody and a secondary rhodamine-conjugated anti-rabbit antibody. Images shown here represent the most prevalent phenotypes. Merged red and green fluorescence images (D and E) are shown in F. Superimposed fluorescence and phase-contrast images (G and H) are shown in I. Mock-transfected cells failed to yield any signal (data not shown).
FIGURE 7.
FIGURE 7.
Subcellular localization of M-DsRed fusion proteins coexpressed with M-EGFP. HeLa cells were cotransfected with M-EGFP and M-DsRed fusion expression vectors bearing the indicated M mutation. At 18 h post-transfection, cells were directly viewed using a laser confocal microscope. Merged red and green fluorescence images are shown (right-hand column panels). Images represent the most prevalent phenotypes.
FIGURE 8.
FIGURE 8.
Membrane flotation centrifugation of M-βgal fusion proteins in the presence of M. 293T cells were cotransfected with the SARS-CoV M expression vector and a β-gal, M101-βgal, or M160-βgal construct, or cotransfected with M160-βgal and an M expression vector carrying an amino-terminal HA tag and a deleted carboxyl-terminal sequence downstream of codon 160 (HA-M160). At 48 h post-transfection, cells were harvested and subjected to membrane flotation centrifugation. Membrane-bound β-gal fusion protein percentages were determined as described in the Fig. 5 legend. Mean and standard deviation values for membrane-bound β-gal-associated proteins are indicated.

Similar articles

Cited by

References

    1. Lai M. M. (1987) Adv. Exp. Med. Biol. 218, 7–13 - PubMed
    1. Spaan W., Cavanagh D., Horzinek M. C. (1988) J. Gen. Virol. 69, 2939–2952 - PubMed
    1. Masters P. S. (2006) Adv. Virus Res. 66, 193–292 - PMC - PubMed
    1. Ziebuhr J. (2004) Curr. Opin. Microbiol. 7, 412–419 - PMC - PubMed
    1. Marra M. A., Jones S. J., Astell C. R., Holt R. A., Brooks-Wilson A., Butterfield Y. S., Khattra J., Asano J. K., Barber S. A., Chan S. Y., Cloutier A., Coughlin S. M., Freeman D., Girn N., Griffith O. L., Leach S. R., Mayo M., McDonald H., Montgomery S. B., Pandoh P. K., Petrescu A. S., Robertson A. G., Schein J. E., Siddiqui A., Smailus D. E., Stott J. M., Yang G. S., Plummer F., Andonov A., Artsob H., Bastien N., Bernard K., Booth T. F., Bowness D., Czub M., Drebot M., Fernando L., Flick R., Garbutt M., Gray M., Grolla A., Jones S., Feldmann H., Meyers A., Kabani A., Li Y., Normand S., Stroher U., Tipples G. A., Tyler S., Vogrig R., Ward D., Watson B., Brunham R. C., Krajden M., Petric M., Skowronski D. M., Upton C., Roper R. L. (2003) Science 300, 1399–1404 - PubMed

Publication types

MeSH terms

LinkOut - more resources