. 2010 Apr;152(4):1914-27.
doi: 10.1104/pp.109.148833. Epub 2010 Feb 12.

Phytochrome regulation of branching in Arabidopsis

Affiliations

Phytochrome regulation of branching in Arabidopsis

Scott A Finlayson et al. Plant Physiol. 2010 Apr.

Abstract

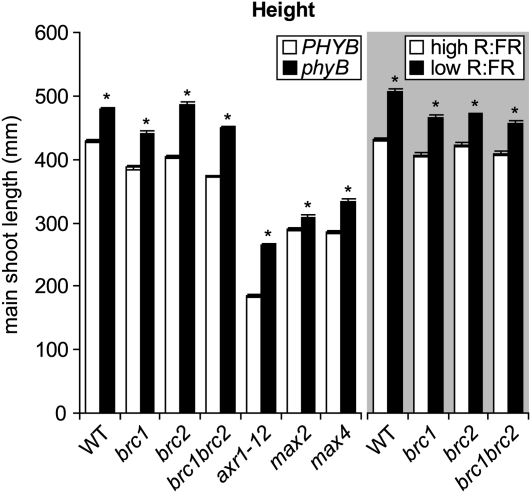
The red light:far-red light ratio perceived by phytochromes controls plastic traits of plant architecture, including branching. Despite the significance of branching for plant fitness and productivity, there is little quantitative and mechanistic information concerning phytochrome control of branching responses in Arabidopsis (Arabidopsis thaliana). Here, we show that in Arabidopsis, the negative effects of the phytochrome B mutation and of low red light:far-red light ratio on branching were largely due to reduced bud outgrowth capacity and an increased degree of correlative inhibition acting on the buds rather than due to a reduced number of leaves and buds available for branching. Phytochrome effects on the degree of correlative inhibition required functional BRANCHED1 (BRC1), BRC2, AXR1, MORE AXILLARY GROWTH2 (MAX2), and MAX4. The analysis of gene expression in selected buds indicated that BRC1 and BRC2 are part of different gene networks. The BRC1 network is linked to the growth capacity of specific buds, while the BRC2 network is associated with coordination of growth among branches. We conclude that the branching integrators BRC1 and BRC2 are necessary for responses to phytochrome, but they contribute differentially to these responses, likely acting through divergent pathways.


Figures

Figure 1.
Figure 1.
Visual phenotypes of various Arabidopsis genotypes at 10 DPA. A, Plants were grown under high R:FR (R:FR of 2.08, PPFD of 180 μmol m−2 s−1, photoperiod of 18 h). B, Plants were grown under high (2.98) or low (0.05) R:FR (175 μmol m−2 s−1 PPFD, photoperiod of 18 h). WT, Wild type.
Figure 2.
Figure 2.
Primary rosette architectural parameters of various Arabidopsis genotypes at 10 DPA with or without functional phyB (left panel of each graph) or under high and low R:FR (shaded right panel of each graph). A and B, Statistical comparisons for primary rosette branch numbers (A) and primary rosette leaf numbers (B) were made within each genotype sufficient (PHYB) or deficient (phyB) for phyB or within each genotype grown under high versus low R:FR. Asterisks indicate significant differences between genotypes or light treatments at α = 0.05. Data are means ± se. C, Standardized primary rosette branch numbers employ regressions to account for correlation between leaf numbers and branch numbers (see text), and error bars represent 95% confidence intervals. For analyses comparing lines with or without functional phyB, n = 28 (phyBmax2) to 87 (wild type [WT]), average n = 51. For high and low R:FR, n = 26 (brc1) to 70 (wild type), average n = 37.
Figure 3.
Figure 3.
Primary rosette bud parameters of various Arabidopsis genotypes at 10 DPA with or without functional phyB (left panel of each graph) or under high and low R:FR (shaded right panel of each graph). A, Statistical comparisons for primary rosette bud numbers were made within each genotype sufficient (PHYB) or deficient (phyB) for phyB or within each genotype grown under high versus low R:FR. Asterisks indicate significant differences between genotypes or light treatments at α = 0.05. Data are means ± se. B, Standardized primary rosette bud numbers employ regressions to account for correlation between leaf numbers and branch numbers (see text), and error bars represent 95% confidence intervals. For analyses comparing lines with or without functional phyB, n = 28 (phyBmax2) to 87 (wild type [WT]), average n = 51. For high and low R:FR, n = 26 (brc1) to 70 (wild type), average n = 37.
Figure 4.
Figure 4.
Overall height of the main shoot of various Arabidopsis genotypes at 10 DPA with or without functional phyB (left panel of the graph) or under high and low R:FR (shaded right panel of the graph). Statistical comparisons were made within each genotype sufficient (PHYB) or deficient (phyB) for phyB or within each genotype grown under high versus low R:FR. Asterisks indicate significant differences between genotypes or light treatments at α = 0.05. Data are means ± se. For analyses comparing lines with or without functional phyB, n = 28 (phyBmax2) to 87 (wild type [WT]), average n = 51. For high and low R:FR, n = 26 (brc1) to 70 (wild type), average n = 37.
Figure 5.
Figure 5.
Elongation of the top three primary rosette branches (A, branch n [uppermost branch]; B, branch n-1 [branch immediately below branch n]; C, branch n-2 [branch immediately below branch n-1]) of wild-type (WT) and phyB plants grown under high R:FR (left) and wild-type plants grown under high and low R:FR (right) with time. Insets show the elongation rates. The maximum sustained elongation rate (MSER [mm h−1]) was calculated by averaging the three greatest sequential daily elongation rates. Onset delay (Δ onset) is the delay in days between the onset of bud outgrowth in the wild type and phyB or between wild-type plants grown in high R:FR and low R:FR and was calculated by estimating the time at which a branch reached 3 mm in length. Asterisks indicate significant differences between genotypes or light treatments at α = 0.05. Data are means ± se; n = 12 to 14. Anthesis occurred on day 0.
Figure 6.
Figure 6.
The lengths of the top three primary rosette branches at 10 DPA plotted against nominal positions of various Arabidopsis genotypes with or without functional phyB and under high and low R:FR. The slope of each line provides a primary correlative inhibition index, with more negative values indicating greater correlative inhibition. Asterisks indicate significant differences between the slopes plotted for the various genotypes or light treatments at α = 0.05. Data are means ± se. For analyses comparing lines with or without functional phyB, n = 28 (phyBmax2) to 87 (wild type [WT]), average n = 51. For high and low R:FR, n = 26 (brc1) to 70 (wild type), average n = 37.
Figure 7.
Figure 7.
Abundance of various mRNAs in unelongated primary rosette bud n (uppermost bud) and bud n-1 (bud immediately below bud n) of wild-type (WT) and phyB plants grown under high R:FR (left panel of each graph) or wild-type plants grown under high and low R:FR (shaded right panel of each graph). Results are means of quantitative PCR analyses of four biological replicates ± se. Bars with different letters are significantly different at α = 0.05.
Figure 8.
Figure 8.
Correlation analysis of the abundance of selected mRNA species regressed against the abundances of BRC1 and BRC2. Significant correlation at q = 0.10 is indicated by black squares.
Figure 9.
Figure 9.
Correlation analysis of the abundance of BRC1 and BRC2 mRNA regressed against primary rosette branch lengths (bud n [uppermost bud] and n-1 [bud immediately below bud n] data regressed together) and correlative inhibition (bud n and n-1 data regressed separately). Significant correlation at α = 0.01 is indicated by black squares.

References

    1. Aguilar-Martínez JA, Poza-Carrión C, Cubas P. (2007) Arabidopsis BRANCHED1 acts as an integrator of branching signals within axillary buds. Plant Cell 19: 458–472 - PMC - PubMed
    1. Alonso JM, Stepanova AN, Leisse TJ, Kim CJ, Chen H, Shinn P, Stevenson DK, Zimmerman J, Barajas P, Cheuk R, et al. (2003) Genome-wide insertional mutagenesis of Arabidopsis thaliana. Science 301: 653–657 - PubMed
    1. Ballaré CL. (1999) Keeping up with the neighbours: phytochrome sensing and other signalling mechanisms. Trends Plant Sci 4: 97–102 - PubMed
    1. Bennett T, Sieberer T, Willett B, Booker J, Luschnig C, Leyser O. (2006) The Arabidopsis MAX pathway controls shoot branching by regulating auxin transport. Curr Biol 16: 553–563 - PubMed
    1. Boe A, Beck DL. (2008) Yield components of biomass in switchgrass. Crop Sci 48: 1306–1311

Publication types

LinkOut - more resources