

Changes in denitrifier abundance, denitrification gene mRNA levels, nitrous oxide emissions, and denitrification in anoxic soil microcosms amended with glucose and plant residues
- PMID: 20154105
- PMCID: PMC2849262
- DOI: 10.1128/AEM.02993-09
Changes in denitrifier abundance, denitrification gene mRNA levels, nitrous oxide emissions, and denitrification in anoxic soil microcosms amended with glucose and plant residues
Abstract
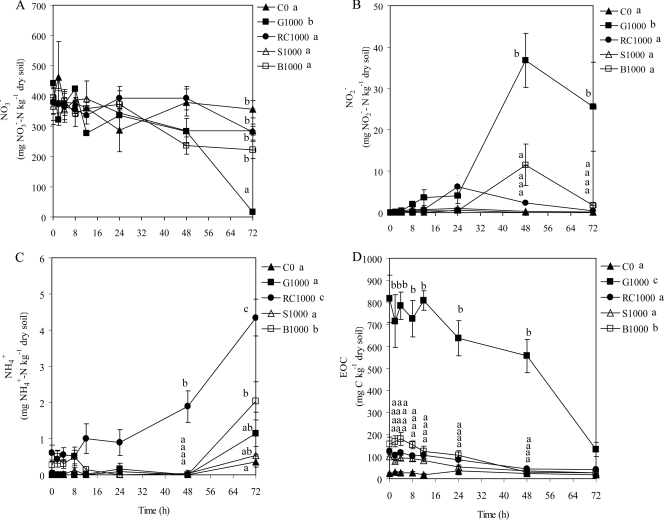
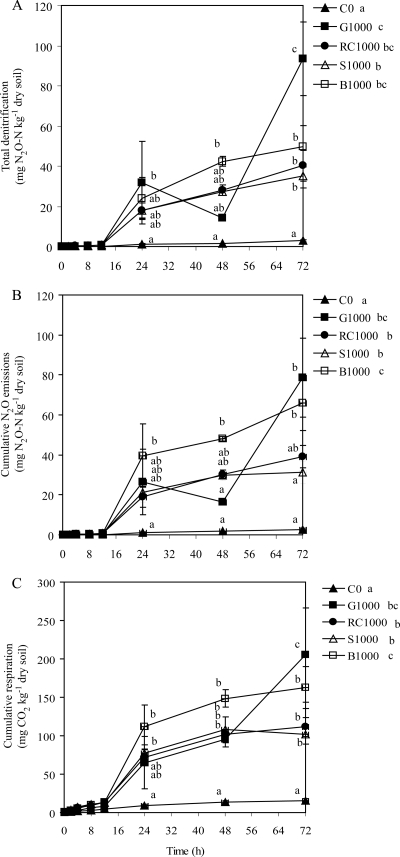
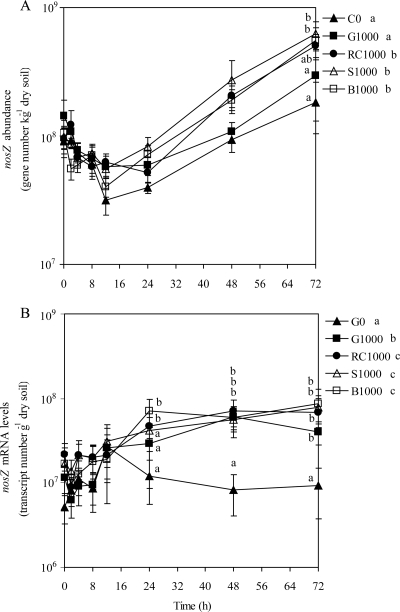
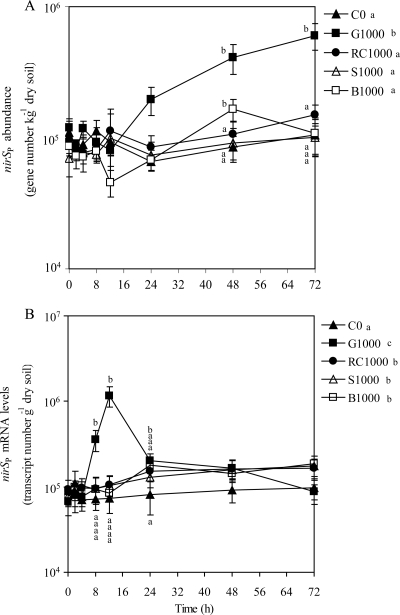
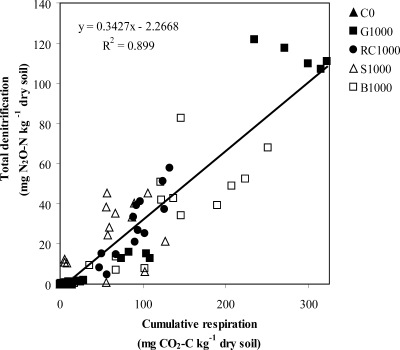
In agricultural cropping systems, crop residues are sources of organic carbon (C), an important factor influencing denitrification. The effects of red clover, soybean, and barley plant residues and of glucose on denitrifier abundance, denitrification gene mRNA levels, nitrous oxide (N(2)O) emissions, and denitrification rates were quantified in anoxic soil microcosms for 72 h. nosZ gene abundances and mRNA levels significantly increased in response to all organic carbon treatments over time. In contrast, the abundance and mRNA levels of Pseudomonas mandelii and closely related species (nirS(P)) increased only in glucose-amended soil: the nirS(P) guild abundance increased 5-fold over the 72-h incubation period (P < 0.001), while the mRNA level significantly increased more than 15-fold at 12 h (P < 0.001) and then subsequently decreased. The nosZ gene abundance was greater in plant residue-amended soil than in glucose-amended soil. Although plant residue carbon-to-nitrogen (C:N) ratios varied from 15:1 to 30:1, nosZ gene and mRNA levels were not significantly different among plant residue treatments, with an average of 3.5 x 10(7) gene copies and 6.9 x 10(7) transcripts g(-1) dry soil. Cumulative N(2)O emissions and denitrification rates increased over 72 h in both glucose- and plant-tissue-C-treated soil. The nirS(P) and nosZ communities responded differently to glucose and plant residue amendments. However, the targeted denitrifier communities responded similarly to the different plant residues under the conditions tested despite changes in the quality of organic C and different C:N ratios.
Figures
Similar articles
-
Changes in bacterial denitrifier community abundance over time in an agricultural field and their relationship with denitrification activity.Appl Environ Microbiol. 2008 Oct;74(19):5997-6005. doi: 10.1128/AEM.00441-08. Epub 2008 Aug 8. Appl Environ Microbiol. 2008. PMID: 18689522 Free PMC article.
-
Insights into the effect of soil pH on N(2)O and N(2) emissions and denitrifier community size and activity.Appl Environ Microbiol. 2010 Mar;76(6):1870-8. doi: 10.1128/AEM.02484-09. Epub 2010 Jan 29. Appl Environ Microbiol. 2010. PMID: 20118356 Free PMC article.
-
Effect of nitrogen and waterlogging on denitrifier gene abundance, community structure and activity in the rhizosphere of wheat.FEMS Microbiol Ecol. 2013 Mar;83(3):568-84. doi: 10.1111/1574-6941.12015. Epub 2012 Oct 17. FEMS Microbiol Ecol. 2013. PMID: 23006139
-
Nitrous Oxide Emission and Denitrifier Abundance in Two Agricultural Soils Amended with Crop Residues and Urea in the North China Plain.PLoS One. 2016 May 6;11(5):e0154773. doi: 10.1371/journal.pone.0154773. eCollection 2016. PLoS One. 2016. PMID: 27152647 Free PMC article.
-
Effect of nitrate and glucose addition on denitrification and nitric oxide reductase (cnorB) gene abundance and mRNA levels in Pseudomonas mandelii inoculated into anoxic soil.Antonie Van Leeuwenhoek. 2011 Aug;100(2):183-95. doi: 10.1007/s10482-011-9577-y. Epub 2011 Mar 24. Antonie Van Leeuwenhoek. 2011. PMID: 21431983
Cited by
-
Nitrogen and Sulfur Additions Improved the Diversity of nirK- and nirS-Type Denitrifying Bacterial Communities of Farmland Soil.Biology (Basel). 2021 Nov 16;10(11):1191. doi: 10.3390/biology10111191. Biology (Basel). 2021. PMID: 34827184 Free PMC article.
-
In-depth analysis of N2O fluxes in tropical forest soils of the Congo Basin combining isotope and functional gene analysis.ISME J. 2021 Nov;15(11):3357-3374. doi: 10.1038/s41396-021-01004-x. Epub 2021 May 25. ISME J. 2021. PMID: 34035444 Free PMC article.
-
Response of N2O emission and denitrification genes to different inorganic and organic amendments.Sci Rep. 2022 Mar 10;12(1):3940. doi: 10.1038/s41598-022-07753-9. Sci Rep. 2022. PMID: 35273224 Free PMC article.
-
N2O Reduction by Gemmatimonas aurantiaca and Potential Involvement of Gemmatimonadetes Bacteria in N2O Reduction in Agricultural Soils.Microbes Environ. 2022;37(2):ME21090. doi: 10.1264/jsme2.ME21090. Microbes Environ. 2022. PMID: 35418546 Free PMC article.
-
Ecological perspectives on microbes involved in N-cycling.Microbes Environ. 2014;29(1):4-16. doi: 10.1264/jsme2.me13159. Epub 2014 Mar 13. Microbes Environ. 2014. PMID: 24621510 Free PMC article. Review.
References
-
- Araki, N., Y. Tsukamoto, A. Nagano, T. Yamaguchi, and H. Harada. 2006. Real time PCR quantification of nitrite reductase (nirS) genes in nitrogen removing fluidized bed reactor. Water Sci. Technol. 53:59-65. - PubMed
-
- Aulakh, M. S., J. W. Doran, D. T. Walters, A. R. Mosier, and D. D. Francis. 1991. Crop residue type and placement effects on denitrification and mineralization. Soil Sci. Soc. Am. J. 55:1020-1025.
-
- Baggs, E. M., R. M. Rees, K. A. Smiths, and A. J. A. Vinter. 2000. Nitrous oxide emissions from soils after incorporating crop residues. Soil Use Manage. 16:82-87.
-
- Bateman, E. J., and E. M. Baggs. 2005. Contributions of nitrification and denitrification to N2O emissions from soils at different water-filled pore space. Biol. Fertil. Soils 41:379-388.
-
- Beauchamp, E. G., J. T. Trevors, and R. W. Paul. 1989. Carbon substrates for bacterial denitrification, p. 113-142. In B. A. Stewart (ed.), Advances in soil science, vol. 10. Springer-Verlag Inc., New York, NY.
Publication types
MeSH terms
Substances
Associated data
- Actions
- Actions
- Actions
- Actions
- Actions
- Actions
- Actions
- Actions
- Actions
- Actions
- Actions
LinkOut - more resources
Full Text Sources
Molecular Biology Databases
