

Environmental determinants of and impact on childhood asthma by the bacterial community in household dust
- PMID: 20154107
- PMCID: PMC2849212
- DOI: 10.1128/AEM.01665-09
Environmental determinants of and impact on childhood asthma by the bacterial community in household dust
Abstract
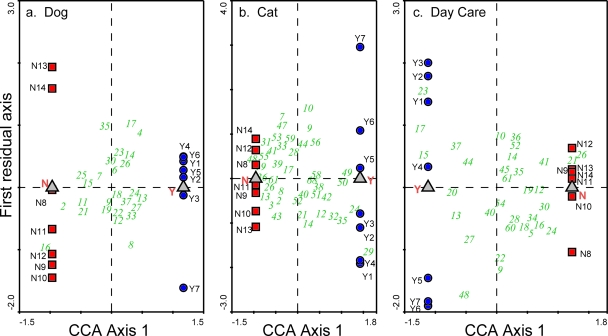
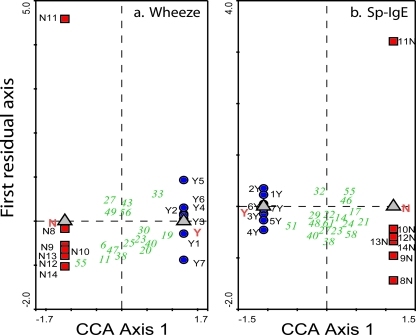
Asthma increased dramatically in the last decades of the 20th century and is representative of chronic diseases that have been linked to altered microbial exposure and immune responses. Here we evaluate the effects of environmental exposures typically associated with asthma protection or risk on the microbial community structure of household dust (dogs, cats, and day care). PCR-denaturing gradient gel analysis (PCR-DGGE) demonstrated that the bacterial community structure in house dust is significantly impacted by the presence of dogs or cats in the home (P = 0.0190 and 0.0029, respectively) and by whether or not children attend day care (P = 0.0037). In addition, significant differences in the dust bacterial community were associated with asthma outcomes in young children, including wheezing (P = 0.0103) and specific IgE (P = 0.0184). Our findings suggest that specific bacterial populations within the community are associated with either risk or protection from asthma.
Figures
Similar articles
-
Bacterial Exposures and Associations with Atopy and Asthma in Children.PLoS One. 2015 Jun 29;10(6):e0131594. doi: 10.1371/journal.pone.0131594. eCollection 2015. PLoS One. 2015. PMID: 26121165 Free PMC article.
-
Soil microbial community structure in an Asian dust source region (Loess plateau).Microbes Environ. 2010;25(1):53-7. doi: 10.1264/jsme2.me09164. Microbes Environ. 2010. PMID: 21576854
-
Molecular analysis of temporal changes of a bacterial community structure in activated sludge using denaturing gradient gel electrophoresis (DGGE) and fluorescent in situ hybridization (FISH).Pol J Microbiol. 2007;56(2):119-27. Pol J Microbiol. 2007. PMID: 17650682
-
[Common problems in the analyses of microbial community by denaturing gradient gel electrophoresis (DGGE)].Wei Sheng Wu Xue Bao. 2006 Apr;46(2):331-5. Wei Sheng Wu Xue Bao. 2006. PMID: 16736603 Review. Chinese.
-
Asthma severity and prevalence: an ongoing interaction between exposure, hygiene, and lifestyle.PLoS Med. 2005 Feb;2(2):e34. doi: 10.1371/journal.pmed.0020034. Epub 2005 Feb 22. PLoS Med. 2005. PMID: 15736993 Free PMC article. Review.
Cited by
-
The infant gut bacterial microbiota and risk of pediatric asthma and allergic diseases.Transl Res. 2017 Jan;179:60-70. doi: 10.1016/j.trsl.2016.06.010. Epub 2016 Jul 9. Transl Res. 2017. PMID: 27469270 Free PMC article. Review.
-
Exposure to dogs and cats and risk of asthma: A retrospective study.PLoS One. 2023 Mar 8;18(3):e0282184. doi: 10.1371/journal.pone.0282184. eCollection 2023. PLoS One. 2023. PMID: 36888591 Free PMC article.
-
Perinatal pet exposure, faecal microbiota, and wheezy bronchitis: is there a connection?ISRN Allergy. 2013 Jan 9;2013:827934. doi: 10.1155/2013/827934. Print 2013. ISRN Allergy. 2013. PMID: 23724248 Free PMC article.
-
Lungs, microbes and the developing neonate.Neonatology. 2015;107(4):337-43. doi: 10.1159/000381124. Epub 2015 Jun 5. Neonatology. 2015. PMID: 26044101 Free PMC article. Review.
-
Asthma.Lancet. 2013 Oct 19;382(9901):1360-72. doi: 10.1016/S0140-6736(13)61536-6. Epub 2013 Sep 13. Lancet. 2013. PMID: 24041942 Free PMC article. Review.
References
-
- Abraham, J. H., P. W. Finn, D. K. Milton, L. M. Ryan, D. L. Perkins, and D. R. Gold. 2005. Infant home endotoxin is associated with reduced allergen-stimulated lymphocyte proliferation and IL-13 production in childhood. J. Allergy Clin. Immunol. 116:431-437. - PubMed
-
- Bach, J. F. 2002. The effect of infections on susceptibility to autoimmune and allergic diseases. N. Engl. J. Med. 347:911-920. - PubMed
-
- Ball, T. M., J. A. Castro-Rodriguez, K. A. Griffith, C. J. Holberg, F. D. Martinez, and A. L. Wright. 2000. Siblings, day-care attendance, and the risk of asthma and wheezing during childhood. N. Engl. J. Med. 343:538-543. - PubMed
-
- Braun-Fahrlander, C., J. Riedler, U. Herz, W. Eder, M. Waser, L. Grize, S. Maisch, D. Carr, F. Gerlach, A. Bufe, R. P. Lauener, R. Schierl, H. Renz, D. Nowak, and E. von Mutius. 2002. Environmental exposure to endotoxin and its relation to asthma in school-age children. N. Engl. J. Med. 347:869-877. - PubMed
Publication types
MeSH terms
Substances
Grants and funding
LinkOut - more resources
Full Text Sources
Medical
Miscellaneous
