Heterochronic phosphorelay gene expression as a source of heterogeneity in Bacillus subtilis spore formation
- PMID: 20154131
- PMCID: PMC2849452
- DOI: 10.1128/JB.01484-09
Heterochronic phosphorelay gene expression as a source of heterogeneity in Bacillus subtilis spore formation
Abstract
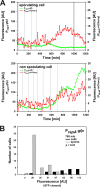
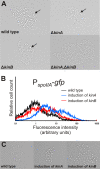
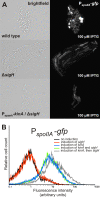
In response to limiting nutrient sources and cell density signals, Bacillus subtilis can differentiate and form highly resistant endospores. Initiation of spore development is governed by the master regulator Spo0A, which is activated by phosphorylation via a multicomponent phosphorelay. Interestingly, only part of a clonal population will enter this developmental pathway, a phenomenon known as sporulation bistability or sporulation heterogeneity. How sporulation heterogeneity is established is largely unknown. To investigate the origins of sporulation heterogeneity, we constructed promoter-green fluorescent protein (GFP) fusions to the main phosphorelay genes and perturbed their expression levels. Using time-lapse fluorescence microscopy and flow cytometry, we showed that expression of the phosphorelay genes is distributed in a unimodal manner. However, single-cell trajectories revealed that phosphorelay gene expression is highly dynamic or "heterochronic" between individual cells and that stochasticity of phosphorelay gene transcription might be an important regulatory mechanism for sporulation heterogeneity. Furthermore, we showed that artificial induction or depletion of the phosphorelay phosphate flow results in loss of sporulation heterogeneity. Our data suggest that sporulation heterogeneity originates from highly dynamic and variable gene activity of the phosphorelay components, resulting in large cell-to-cell variability with regard to phosphate input into the system. These transcriptional and posttranslational differences in phosphorelay activity appear to be sufficient to generate a heterogeneous sporulation signal without the need of the positive-feedback loop established by the sigma factor SigH.
Figures


Similar articles
-
Phosphatases modulate the bistable sporulation gene expression pattern in Bacillus subtilis.Mol Microbiol. 2005 Jun;56(6):1481-94. doi: 10.1111/j.1365-2958.2005.04659.x. Mol Microbiol. 2005. PMID: 15916600
-
Novel modulators controlling entry into sporulation in Bacillus subtilis.J Bacteriol. 2013 Apr;195(7):1475-83. doi: 10.1128/JB.02160-12. Epub 2013 Jan 18. J Bacteriol. 2013. PMID: 23335417 Free PMC article.
-
Multiple protein-aspartate phosphatases provide a mechanism for the integration of diverse signals in the control of development in B. subtilis.Cell. 1994 Dec 16;79(6):1047-55. doi: 10.1016/0092-8674(94)90035-3. Cell. 1994. PMID: 8001132
-
The phosphorelay signal transduction pathway in the initiation of Bacillus subtilis sporulation.J Cell Biochem. 1993 Jan;51(1):55-61. doi: 10.1002/jcb.240510111. J Cell Biochem. 1993. PMID: 8432743 Review.
-
Coordination of cell decisions and promotion of phenotypic diversity in B. subtilis via pulsed behavior of the phosphorelay.Bioessays. 2016 May;38(5):440-5. doi: 10.1002/bies.201500199. Epub 2016 Mar 4. Bioessays. 2016. PMID: 26941227 Review.
Cited by
-
Phenotypic memory in Bacillus subtilis links dormancy entry and exit by a spore quantity-quality tradeoff.Nat Commun. 2018 Jan 4;9(1):69. doi: 10.1038/s41467-017-02477-1. Nat Commun. 2018. PMID: 29302032 Free PMC article.
-
Temporal competition between differentiation programs determines cell fate choice.Mol Syst Biol. 2011 Dec 6;7:557. doi: 10.1038/msb.2011.88. Mol Syst Biol. 2011. PMID: 22146301 Free PMC article.
-
Bioluminescence dynamics in single germinating bacterial spores reveal metabolic heterogeneity.J R Soc Interface. 2020 Sep;17(170):20200350. doi: 10.1098/rsif.2020.0350. Epub 2020 Sep 9. J R Soc Interface. 2020. PMID: 32900305 Free PMC article.
-
YodL and YisK Possess Shape-Modifying Activities That Are Suppressed by Mutations in Bacillus subtilis mreB and mbl.J Bacteriol. 2016 Jul 13;198(15):2074-88. doi: 10.1128/JB.00183-16. Print 2016 Aug 1. J Bacteriol. 2016. PMID: 27215790 Free PMC article.
-
Time Series Analysis of the Bacillus subtilis Sporulation Network Reveals Low Dimensional Chaotic Dynamics.Front Microbiol. 2016 Nov 7;7:1760. doi: 10.3389/fmicb.2016.01760. eCollection 2016. Front Microbiol. 2016. PMID: 27872618 Free PMC article.
References
-
- Asai, K., M. Fujita, F. Kawamura, H. Takahashi, Y. Kobayashi, and Y. Sadaie. 1998. Restricted transcription from Sigma H or phosphorylated Spo0A dependent promoters in the temperature-sensitive secA341 mutant of Bacillus subtilis. Biosci. Biotechnol. Biochem. 62:1707-1713. - PubMed
-
- Ben-Yehuda, S., and R. Losick. 2002. Asymmetric cell division in B. subtilis involves a spiral-like intermediate of the cytokinetic protein FtsZ. Cell 109:257-266. - PubMed
-
- Burbulys, D., K. A. Trach, and J. A. Hoch. 1991. Initiation of sporulation in B. subtilis is controlled by a multicomponent phosphorelay. Cell 64:545-552. - PubMed
-
- Castilla-Llorente, V., M. Salas, and W. J. Meijer. 2008. kinC/D-mediated heterogeneous expression of spo0A during logarithmical growth in Bacillus subtilis is responsible for partial suppression of phi 29 development. Mol. Microbiol. 68:1406-1417. - PubMed
Publication types
MeSH terms
Substances
LinkOut - more resources
Full Text Sources
Other Literature Sources

