. 2010 Apr;30(8):1910-22.
doi: 10.1128/MCB.01089-09. Epub 2010 Feb 12.

Kinetics of hedgehog-dependent full-length Gli3 accumulation in primary cilia and subsequent degradation

Affiliations

Kinetics of hedgehog-dependent full-length Gli3 accumulation in primary cilia and subsequent degradation

Xiaohui Wen et al. Mol Cell Biol. 2010 Apr.

Abstract

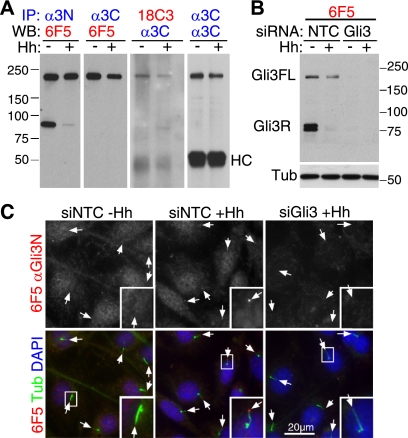
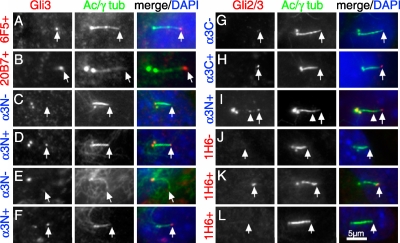
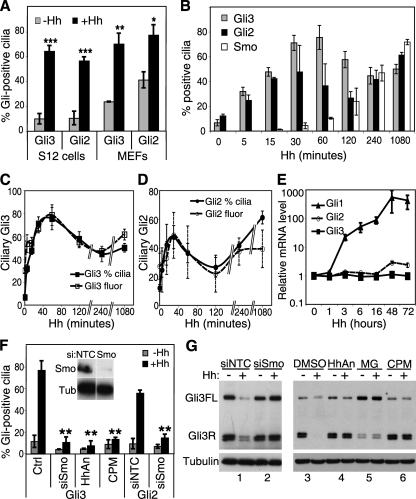
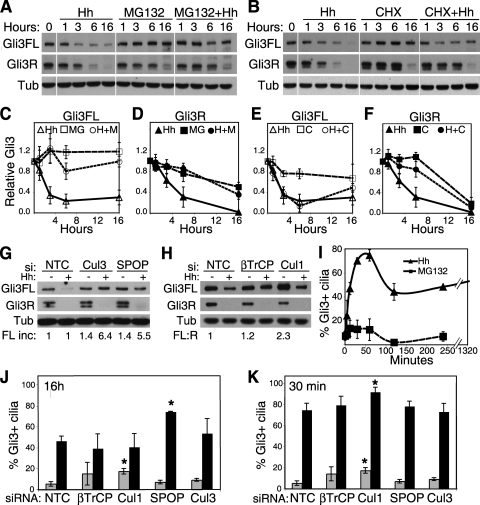
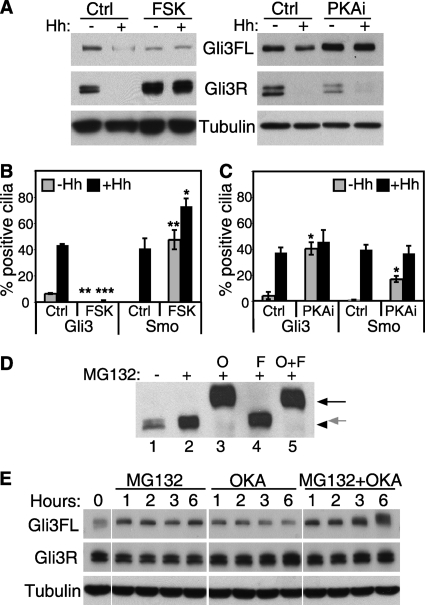
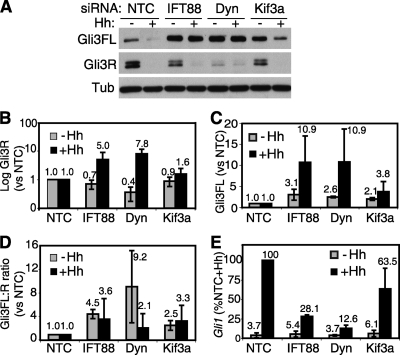
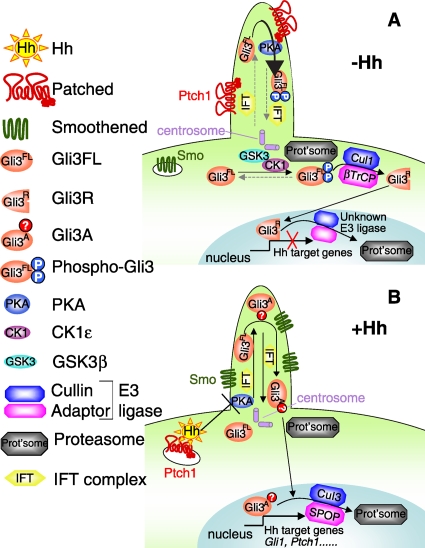
Hedgehog (Hh) signaling in vertebrates depends on intraflagellar transport (IFT) within primary cilia. The Hh receptor Patched is found in cilia in the absence of Hh and is replaced by the signal transducer Smoothened within an hour of Hh stimulation. By generating antibodies capable of detecting endogenous pathway transcription factors Gli2 and Gli3, we monitored their kinetics of accumulation in cilia upon Hh stimulation. Localization occurs within minutes of Hh addition, making it the fastest reported readout of pathway activity, which permits more precise temporal and spatial localization of Hh signaling events. We show that the species of Gli3 that accumulates at cilium tips is full-length and likely not protein kinase A phosphorylated. We also confirmed that phosphorylation and betaTrCP/Cul1 are required for endogenous Gli3 processing and that this is inhibited by Hh. Surprisingly, however, Hh-dependent inhibition of processing does not lead to accumulation of full-length Gli3, but instead renders it labile, leading to its proteasomal degradation via the SPOP/Cul3 complex. In fact, full-length Gli3 disappears with faster kinetics than the Gli3 repressor, the latter not requiring SPOP/Cul3 or betaTrCP/Cul1. This may contribute to the increased Gli3 activator/repressor ratios found in IFT mutants.


Figures

FIG. 1.
FIG. 1.
Detection of endogenous Gli3 in S12 cells. (A) Endogenous Gli3 can be immunoprecipitated and detected by Western blotting. Extracts of S12 cells treated for 16 h with (+) or without (-) Hh were immunoprecipitated (IP) with anti-Gli3N pAb, anti-Gli3C pAb, or MAb 18C3 and Western blotted (WB) with anti-Gli3N MAb 6F5 or anti-Gli3C pAb as indicated (pAbs are shown in blue and MAb clones are in red). Molecular mass markers in kDa are indicated on the left. HC, antibody heavy chain. (B) 6F5 anti-Gli3N MAb is specific for Gli3. Extracts of S12 cells transfected with nontargeting control (NTC) or Gli3 siRNAs with or without Hh treatment for 16 h were Western blotted with 6F5. Tub, antitubulin loading control. (C) Immunofluorescence detection of endogenous Gli3. S12 cells transfected with nontargeting control (siNTC) or Gli3 (siGli3) siRNAs with or without 30-min Hh stimulation were costained with 6F5 (red channel and upper panels), cilia and centrosomes (anti-acetylated tubulin and anti-γ-tubulin, respectively (Tub) (green channel), and DAPI (blue channel) for nuclei. Arrows indicate cilium tips. Bar, 20 μm. Insets show 3× magnifications of the boxed regions.
FIG. 2.
FIG. 2.
Gli3 and Gli2 accumulate at cilium tips in response to Hh in multiple cell lines. IMCD3 (A, B, and G to I), 3T3 (C and D), primary E10.5 MEF (E and F), or S12 (J to L) cells were treated for 16 h in the absence or presence of Hh and costained with various antibodies to Gli3 or Gli2 in the red channel (left), acetylated tubulin (cilia) and γ-tubulin (centrosomes) together in the green channel (middle), and merged with DAPI (blue) on the right. (A and B) Gli3N MAb 6F5 (A) and 20B7 (B) staining of IMCD3 cells with Hh. (C to F) Gli3N pAb 2676 staining of 3T3 (C and D) and MEF (E and F) cells with or without Hh treatment; pAb 2676 also nonspecifically stains the centrosome (see Fig. S2C and D in the supplemental material). (G and H) Anti-Gli3C pAb 2438 staining of IMCD3 cells with or without Hh. An additional Gli3 spot (arrowhead) along the cilium (I), here in IMCD3 cells in the presence of Hh. (J to L) Anti-Gli2C MAb 1H6 staining of S12 cells without Hh (J), with Hh (K), and with Hh after Gli2 siRNA transfection (L). pAbs are labeled alongside in blue, and MAbs are in red, with + or - indicating the presence or absence of Hh, respectively. White arrows indicate cilium tips.
FIG. 3.
FIG. 3.
Gli3 and Gli2 accumulation at cilium tips is rapid and requires active Smo. (A) Quantitation of Gli3 and Gli2 accumulation at cilium tips following Hh stimulation. S12 cells and E10.5 MEFs were treated for 24 h with or without Hh, then stained for cilia, centrosomes, and Gli3 (2676) or Gli2 (1H6). At least 150 cilia were scored (as in Fig. S3 of the supplemental material) in each of three (MEF) or five (S12) independent experiments, and the mean ± SD was plotted. Asterisks denote statistical significance between experiments with and without Hh according to the t test. *, P ≤ 0.05; **, P ≤ 0.01; ***, P ≤ 0.001. (B) Time course of Hh-dependent Gli and Smo ciliary accumulation. S12 cells stimulated with Hh for the indicated times were stained for Gli2 (1H6) or Gli3 (2676) and quantitated as for panel A. Smo (5928B) was stained and quantitated as for Fig. S5C in the supplemental material. (C) Correlation between ciliary Gli3 qualitative scoring method used for panel B and quantitative fluorescence intensities measured with ImageJ (arbitrary fluorescence units divided by 30 to fit on the same scale). (D) Same experiment as for panel C, except this experiment compared ciliary Gli2 qualitative (•) and quantitative (○; 1.15×) signals. (E) Gli3 mRNA levels are not altered by Hh stimulation. S12 cells were treated with Hh for the indicated times, and then Gli1, Gli2, and Gli3 mRNA levels were assessed by qPCR, normalized to RPL19, and expressed relative to unstimulated cells. Gli3 did not show any significant change, but Gli1 was upregulated by Hh as expected. Data are the means and SD of two to four independent experiments for each time point. (F) Active Smo is required for Hh-dependent Gli3 and Gli2 accumulation at cilium tips. NTC siRNA- or Smo siRNA-transfected S12 cells were treated with or without Hh for 30 min. Alternatively, S12 cells were treated for 1 h with DMSO, 100 nM HhAntag (HhAn), or 5 μM cyclopamine (CPM) with or without Hh for the final 30 min. Ciliary Gli3 or Gli2 was quantitated as for panel B in two independent experiments of ≥200 cilia. siNTC and DMSO gave similar results for Gli3, and so the combined data are shown (Ctrl). **, P ≤ 0.01 versus Hh-treated control. The inset is a 14A5 MAb Western blot of Smo knockdown versus siNTC with tubulin loading controls (Tub). (G) Smo knockdown or inactivation prevents Hh-mediated inhibition of Gli3 processing and degradation. S12 cells were treated as for panel F, except that Hh and drug treatments were for 16 h, and then blotting was performed with 6F5 as for Fig. 1B. Lanes: 1, nontargeting control siRNA; 2, Smo siRNA; 3, DMSO control; 4, 100 nM HhAntag; 5,10 μM MG132; 6, 5 μM cyclopamine.
FIG. 4.
FIG. 4.
Gli3FL and Gli3R are processed and degraded by independent proteasomal pathways. (A) Gli3 Western blotting time course of MG132 with and without Hh treatment. S12 cells were serum starved for 16 h alone (0) or with Hh, 10 μM MG132, or both for 1, 3, 6, or 16 h and then blotted with 6F5 as described for Fig. 1B. The blot shown is representative of ≥6 experiments, with white lines drawn between different treatments. The empty blot between Gli3FL and Gli3R was excised to save space. (B) Gli3 Western blotting time course of cycloheximide with or without Hh treatment. The experiment was similar to that in panel A, except 10 μg/ml CHX replaced MG132. The single blot shown is representative of four experiments, with white lines separating treatments. (C and D) Quantitation of Gli3 levels in panel A. Gli3FL (C) and Gli3R (D) bands were normalized to the tubulin loading controls and plotted relative to untreated cells, assigned a value of 1 (means and SDs of 6 to 10 experiments, one of which is shown in panel A). H+M, Hh and MG132. For easier comparisons of Gli3FL and Gli3R, combined graphs are presented in Fig. S6 of the supplemental material. (E and F) Quantitation of Gli3 levels in panel B. The same experiment was performed as in panels C and D, except CHX (C) replaced MG132; data shown are from four experiments (10 for Hh), one being shown in panel B. C, CHX only; H+C, Hh and CHX. See also Fig. S6A, D, and E in the supplemental material. (G) SPOP or Cul3 knockdown inhibits the Hh-induced degradation of Gli3FL without affecting processing. S12 cells transfected with siRNAs to SPOP or Cul3 were treated for 16 h in the presence or absence of Hh and then blotted as described for panel A. The mean increase in Gli3FL relative to siNTC with or without Hh from three independent blots is shown underneath this representative blot. (H) βTrCP or Cul1 knockdown inhibits Gli3R formation while permitting Hh-dependent degradation of Gli3FL. The experiment was similar to that shown in panel G, except siRNAs were to βTrCP or Cul1. The mean Gli3FL:R ratio of two blots relative to siNTC without Hh is shown underneath (the absence of Gli3R with Hh precluded ratio calculations). (I) Time course of Gli3 accumulation in cilia with MG132 treatment. S12 cells treated with Hh or MG132 for different times were stained for ciliary Gli3 (2676 pAb) and quantitated as in Fig. S2 of the supplemental material. No cilia remained after 16 h of MG132 treatment, so that the curve ends at 6 h. (J and K) Knockdown of E3 ligases increases Gli3-positive cilia. S12 cells transfected with siRNAs to βTrCP, Cul1, SPOP, or Cul3 were treated with or without Hh for 16 h (J) or 30 min (K), stained, and quantitated as for panel I. The mean and SD of two to three independent experiments is shown. *, P ≤ 0.05.
FIG. 5.
FIG. 5.
Ciliary Gli3 is not PKA phosphorylated and is processed or dynamically dephosphorylated. (A) FSK stimulates Gli3 processing and the PKA inhibitor myristoylated 14-22 amide (PKAi) prevents it. 6F5 blots of S12 cells treated for 16 h with 40 μM FSK or vehicle (Ctrl) with or without Hh (left panel) or 20 μM PKAi or vehicle (Ctrl) with or without Hh (right panel). (B) FSK inhibits Hh-dependent accumulation of Gli3 but not Smo in cilia. Cells were treated for 4 h with 40 μM FSK or vehicle (Ctrl) in the absence of presence of Hh, then stained and scored for ciliary Gli3 (2676, left) or Smo (right) as in Fig. 3B (mean and SD of two independent experiments). *, P ≤ 0.05; **, P ≤ 0.01; ***, P ≤ 0.001 versus the corresponding control with or without Hh. (C) PKA inhibition results in Hh-independent accumulation of Gli3 and Smo in cilia. An experiment similar to that in panel B was performed, except 20 μM PKAi replaced FSK. (D) Endogenous Gli3 is dynamically phosphorylated and dephosphorylated. Extracts of S12 cells treated for 16 h (+) or not (-) with 10 μM MG132 and 100 nM okadaic acid (O; lane 3), 40 μM forskolin (F; lane 4), or both (lane 5) were run on a 4% SDS-PAGE gel and blotted with 6F5. Black arrowhead, Gli3FL; gray arrow, presumptive phospho-Gli3FL; black arrow, presumptive hyperphosphorylated Gli3FL. (E) At least 3 h is required to accumulate hyperphosphorylated Gli3 in the absence of proteasomal activity. Four to 12% 6F5 blots of S12 cells treated for the indicated times with 10 μM MG132, 100 nM OKA, or both. The samples are all on the same blot, with vertical lines drawn for easier viewing.
FIG. 6.
FIG. 6.
IFT and microtubules are required for both processing and degradation of Gli3FL. (A) Knockdown of IFT components inhibits both Gli3FL processing and degradation. Shown is a 6F5 blot of S12 cells transfected with siRNAs to the NTC, IFT88, Dync2h1 (Dyn), or Kif3a and treated for 16 h in the presence of absence of Hh. (B) Quantitation of Gli3R relative to siNTC from three blots, with a representative one shown in panel A. Note that the log scale better reveals the decrease in Gli3R upon ift knockdown. (C) Quantitation of Gli3FL in the same three blots as in panel B. (D) Gli3FL:R ratios from panels B and C, normalized to 1 for siNTC. (E) Gli1 levels measured by qPCR and normalized to siNTC plus Hh (16 h) as 100%.
FIG. 7.
FIG. 7.
Working model for Gli3 translocation, processing, and degradation. (A) In the absence of Hh, Ptch, but not Smo, is present in cilia, and Gli3 (and Gli2) may translocate at low levels into and out of cilia (denoted by dashed arrows), where PKA could phosphorylate them. However, cilia are not absolutely required for Gli3 processing, so PKA phosphorylation could also occur in the cytoplasm, priming Glis for further phosphorylation by centrosomal CK1ɛ and GSK3β. Phosphorylated Gli3 binds the centrosomal βTrCP/Cul1 complex, becoming ubiquitinated and processed by the pericentrosomal proteasome into Gli3R, which presumably translocates to the nucleus to inhibit transcription by Gli2 and Gli1 prior to degradation by an unknown E3 ligase complex. (B) In the presence of Hh, Smo replaces Ptch in cilia and Gli3FL (and Gli2FL) accumulate at the distal tips via IFT (denoted by solid arrows). PKA phosphorylation is inhibited, preventing βTrCP/Cul1 binding and processing. We propose an as-yet unidentified modification (red circle) occurs at cilium tips to activate the Gli3 (into Gli3A), which not only prevents it from being processed, but also permits subsequent transport to the nucleus to allow activation of transcription of Hh target genes, including Gli1 and Ptch1. Following this, Gli3A is ubiquitinated by the SPOP/Cul3 complex and degraded by the proteasome.

Similar articles

Cited by

References

    1. Agren, M., P. Kogerman, M. I. Kleman, M. Wessling, and R. Toftgard. 2004. Expression of the PTCH1 tumor suppressor gene is regulated by alternative promoters and a single functional Gli-binding site. Gene 330:101-114. - PubMed
    1. Alexandre, C., A. Jacinto, and P. W. Ingham. 1996. Transcriptional activation of Hedgehog target genes in Drosophila is mediated directly by the cubitus interruptus protein, a member of the GLI family of zinc finger DNA-binding proteins. Genes Dev. 10:2003-2013. - PubMed
    1. Aza-Blanc, P., H. Y. Lin, A. Ruiz i Altaba, and T. B. Kornberg. 2000. Expression of the vertebrate Gli proteins in Drosophila reveals a distribution of activator and repressor activities. Development 127:4293-4301. - PubMed
    1. Aza-Blanc, P., F. A. Ramirez-Weber, M. P. Laget, C. Schwartz, and T. B. Kornberg. 1997. Proteolysis that is inhibited by Hedgehog targets Cubitus interruptus protein to the nucleus and converts it to a repressor. Cell 89:1043-1053. - PubMed
    1. Brooks, P., G. Fuertes, R. Z. Murray, S. Bose, E. Knecht, M. C. Rechsteiner, K. B. Hendil, K. Tanaka, J. Dyson, and J. Rivett. 2000. Subcellular localization of proteasomes and their regulatory complexes in mammalian cells. Biochem. J. 346:155-161. - PMC - PubMed

MeSH terms