. 2010 Apr;30(8):1984-96.
doi: 10.1128/MCB.00007-10. Epub 2010 Feb 12.

The AAA+ ATPase ATAD3A controls mitochondrial dynamics at the interface of the inner and outer membranes

Affiliations

The AAA+ ATPase ATAD3A controls mitochondrial dynamics at the interface of the inner and outer membranes

Benoît Gilquin et al. Mol Cell Biol. 2010 Apr.

Abstract

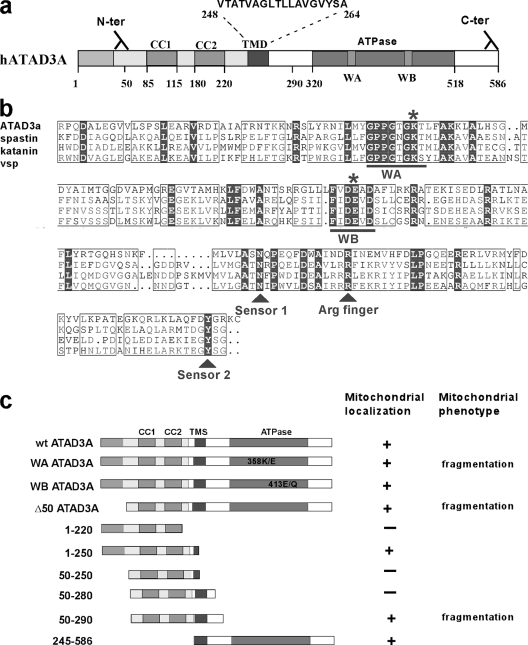
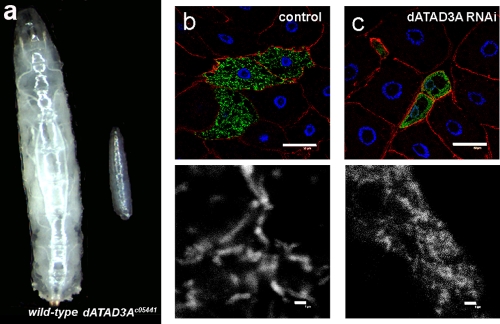
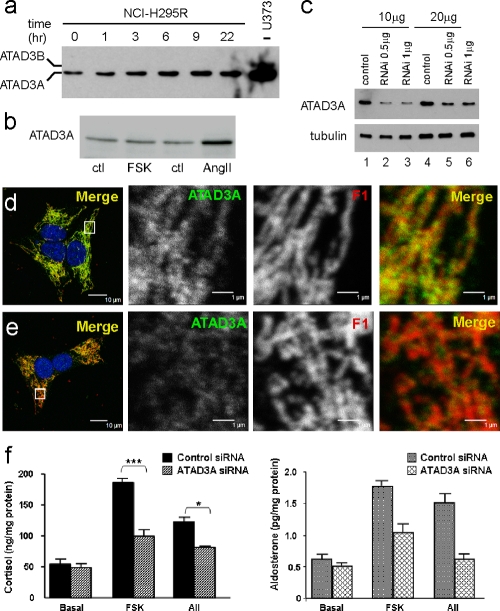
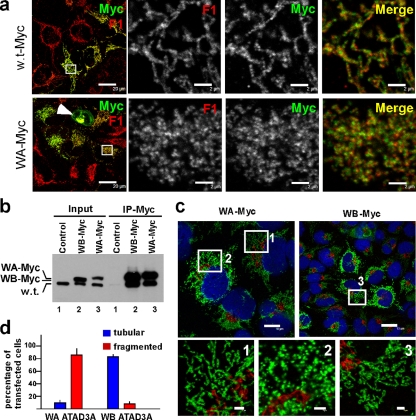
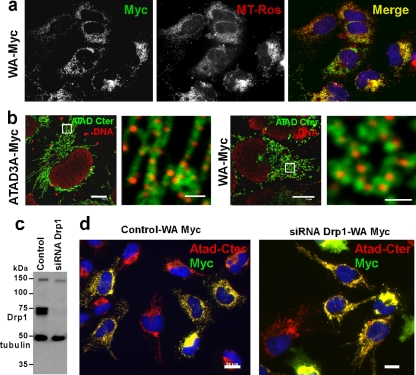
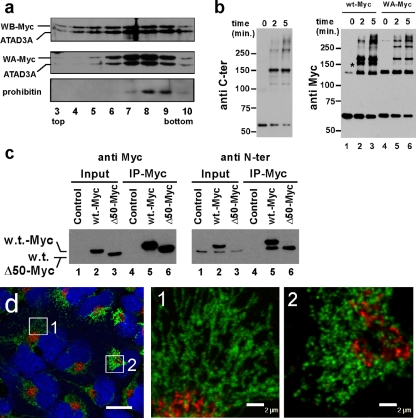
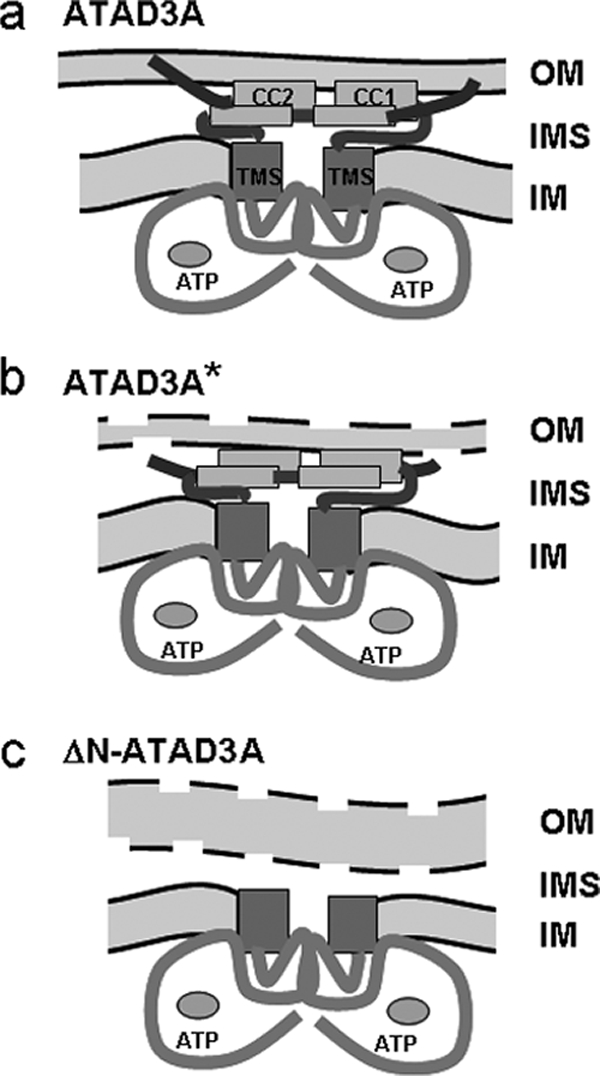
Dynamic interactions between components of the outer (OM) and inner (IM) membranes control a number of critical mitochondrial functions such as channeling of metabolites and coordinated fission and fusion. We identify here the mitochondrial AAA(+) ATPase protein ATAD3A specific to multicellular eukaryotes as a participant in these interactions. The N-terminal domain interacts with the OM. A central transmembrane segment (TMS) anchors the protein in the IM and positions the C-terminal AAA(+) ATPase domain in the matrix. Invalidation studies in Drosophila and in a human steroidogenic cell line showed that ATAD3A is required for normal cell growth and cholesterol channeling at contact sites. Using dominant-negative mutants, including a defective ATP-binding mutant and a truncated 50-amino-acid N-terminus mutant, we showed that ATAD3A regulates dynamic interactions between the mitochondrial OM and IM sensed by the cell fission machinery. The capacity of ATAD3A to impact essential mitochondrial functions and organization suggests that it possesses unique properties in regulating mitochondrial dynamics and cellular functions in multicellular organisms.


Figures

FIG. 1.
FIG. 1.
Characteristics of the ATAD3A protein. (a) Schematic representation of human ATAD3A protein. The epitope domains for N-ter and C-ter antibodies, the two coiled-coil domains (CC1 and CC2), the predicted transmembrane sequence (TMS), and the ATP binding domain conserved in the AAA protein family are indicated. (b) Protein alignment of the AAA domain of hATAD3A with the AAA proteins spastin, katanin, and Vsp4 p. The asterisk indicates the lysine amino acid and glutamic amino acid whose mutation abrogates ATP binding or ATP hydrolysis in Vsp4p (1). (c) Schematic representation of the various C terminus Myc-tagged ATAD3A mutants used in the present study.
FIG. 2.
FIG. 2.
Characterization of mitochondrial ATAD3A topology. (a) Sucrose-density gradient profile of mitochondrial membrane fragments. Fractions from top to bottom were analyzed by immunoblotting. Markers: Ant-1, an integral protein of the IM; porin, an integral protein of the OM that also interacts with the IM. (b to h) Trypsin sensitivity of mitochondrial ATAD3A. (b) Time course proteolysis of mitochondria in isotonic (SW −) or hypotonic (SW +) buffer, in the absence of NaCl. Trypsin was added at a concentration of 5 μg/ml. (c) Time course proteolysis of mitochondria with low trypsin concentration (0.5 μg/ml) in hypotonic buffer in the absence of NaCl. (d) Time course proteolysis of mitochondria in hypotonic buffer, in the absence of NaCl, and in the presence of 0.3% Triton X-100. Trypsin was added at a concentration of 1 μg/ml. (e) Mitochondria in hypotonic buffer, in the absence of NaCl, were incubated with trypsin (1 μg/ml). After 5 min, increasing concentrations of Triton X-100 were added, and the mitochondria were incubated for an additional 5 min. The right lane is the mitochondrial preparation that was left without trypsin during the time of the experiment. (f) Mitochondria in hypotonic buffer and in the presence of 120 mM NaCl were incubated with increasing trypsin concentrations as indicated, in the absence (−) or presence (+) of 0.3% Triton X-100 for 5 min. (g) Mitochondria in isotonic buffer in the absence (−) or in the presence (+) of 120 mM NaCl were incubated 10 min with trypsin (5 μg/ml) and increasing digitonin concentrations as indicated. (h) Mitochondria in isotonic buffer in the presence (+) of 0.8 mg of digitonin/ml were incubated for 10 min with increasing trypsin concentrations as indicated. In panels b to h, immunoblots were probed with antibodies as indicated in the left margins. In panel b, ATAD3A C-ter and prohibitin antibodies were used on the same Western blot membrane. In panels e and g, OPA1 and ATAD3A N-ter antibodies were used on the same Western blot membrane. See the text for details.
FIG. 3.
FIG. 3.
Characterization of regions that determine mitochondrial targeting of ATAD3A. (a) Double immunofluorescence analysis of the 245-586 ATAD3A-Myc mutant in transfected U373 cells with anti-Myc (red) and anti-ATAD3-Cter (green) antibodies shows mitochondrial localization. (b) Analysis of the solubility of the mitochondrial 245-586 ATAD3A-Myc protein. Endogenous ATAD3A and 245-586 ATAD3A-Myc proteins in supernatants (S) and pellets (P) were analyzed with anti-ATAD3A C-ter antibody. (c) Time course proteolysis of mitochondria purified from transfected cells with 245-586 ATAD3A-Myc plasmid in isotonic buffer, in the absence or in the presence of Triton X-100. ATAD3A proteins were detected with anti-ATAD3A C-ter (upper panel) or N-ter (lower panel) antibodies. The positions of ATAD3 proteins and fragments are indicated in the left margin. (d to f) Indirect immunofluorescence analysis of U373 cells transfected with Myc-tagged Δ50-250 (d), Δ50-280 (e), and Δ50-290 (f) mutants with anti-Myc (green) and anti-ATP synthase F1 (red). DNA staining with Hoechst is in blue. High-magnification observations of squared areas are also shown. Bars: 10 μm (d and f) and 20 μm (e).
FIG. 4.
FIG. 4.
Characterization of the ATAD3A N-terminal domain. (a) U373 cells transfected with 1-250 ATAD3A-Myc plasmid were double immunostained with anti-Myc antibody (green) and anti-ATAD3A C-ter antibody (red). Cells were observed under confocal microscopy at a low resolution (left panel; bar, 20 μm) and the squared area was observed at a high resolution (right panels; bar, 10 μm). (b) Analysis of the mitochondrial 1-250 ATAD3A-Myc protein solubility. Endogenous ATAD3A/B and 1-250 ATAD3A-Myc protein in supernatants (S) and pellets (P) were analyzed with anti-ATAD3 N-ter antibody. (c) Time course proteolysis of mitochondria purified from transfected cells with 1-250 ATAD3A-Myc plasmid in isotonic (SW−) or hypotonic (SW+) buffer. Proteins were analyzed with anti-ATAD3 N-ter and anti-Myc antibodies as indicated. Asterisks indicate the position of a trypsin-resistant N-ter fragment. (d) Analysis of 1-245 ATAD3A oligomerization in Yeast two-hybrid assay. Serial dilution (1, 1:10, and 1:1,000) of yeast strains coexpressing each pair of the indicated bait and prey proteins were grown on SD/−Leu/−Trp and SD/−Ade/−His/−Leu/−Trp agar plates at 30° for 4 days. DNA-BD/murine p53 fusion protein and AD/SV40 large T antigen fusion protein were used as positive controls of protein interaction. (e) Wild-type ATAD3A was cotranslated with 1-220 (lanes 1), 1-250 (lanes 2), or 1-280 (lanes 3) ATAD3A-Myc fragments in rabbit reticulocyte. Total lysates (input) or Myc immunoprecipitates (IP-Myc) were analyzed by SDS-PAGE and autoradiography. (f) Time course cross-linking of purified mitochondria expressing the 1-250-Myc protein with DTSSP. Proteins were resolved by SDS-10.5% PAGE and analyzed by immunoblotting with anti-Myc antibody.
FIG. 5.
FIG. 5.
ATAD3A is required for cell growth in Drosophila. (a) Size comparison of wild-type and dATAD3Ac05441 homozygous mutant larvae at 120 h of development. After this time point, dATAD3Ac05441 homozygotes fail to enter the pupal stage and die. (b and c) Clonal expression of the mitochondrial GFP in fat body of control cells (b) (genotype: y, w, hsFLP; Act5C>CD2>GAL4, UAS-MitoGFP/+), and in cells expressing the dsRNA targeting dATAD3A (c) (genotype: y, w, hsFLP; UAS-dATAD3AIR/+; Act5C>CD2>GAL4, UAS-MitoGFP/+). In panels b and c, fat bodies were stained with phalloidin (red) and Hoechst (blue) and observed under confocal microscopy at low (upper panels; bar, 50 μm) and high (lower panels; bar, 1 μm) resolutions. Mitochondrial GFP is in green (upper panels) or in white (lower panels).
FIG. 6.
FIG. 6.
ATAD3A assists steroidogenesis in NCI-H295R cells. (a) Time course induction of ATAD3A in NCI-H295R cells stimulated with AII (10 nM). In the left lane is U373 cell extract. (b) NCI-H295R cells were not stimulated (ctl) or were stimulated with FSK (10 μM) or AII (10 nM) for 3 h. In panels a and b, total cell extracts (20 μg of protein) were analyzed for ATAD3A content by Western blotting with ATAD3 N-ter antibody. (c) Total cell extract (10 μg of protein or 20 μg of proteins as indicated) of NCI-H295R cells transfected with control siRNA without target (control) or with two concentrations of siRNA directed against human ATAD3A were analyzed by Western blotting for ATAD3A with ATAD3A N-ter antibody. (d and e) NCI-H295R cells transfected with control siRNA (d) or siRNA directed against ATAD3A (e) were analyzed by indirect immunofluorescence with anti-ATAD3A C-ter (green) and anti-ATP synthase F1 (red) antibodies. Bar, 10 μm. In the right panels are high-magnification observations of squared area shown in left panel. Bar, 1 μm. (f) NCI H295R cells transfected with control or ATAD3A siRNA were left unstimulated (basal) or were stimulated with FSK (10 μM) or AII (10 nM). Cortisol (left panel) and aldosterone (right panel) production was measured in the culture medium by RIA and standardized to total cellular protein levels. In left panel, data represent means ± the standard error of the mean (SEM) of three independent experiments performed in duplicate. * and ***, significantly different from control siRNA (P < 0.05 and P < 0.001, respectively). One-way analysis of variance with the Bonferroni post hoc test was used. A P value of <0.05 was considered statistically significant.
FIG. 7.
FIG. 7.
ATPase-defective ATAD3A mutant disorganizes mitochondrial tubules in U373 cells. (a) U373 cells transfected with plasmids encoding wild-type ATAD3A-Myc or WA ATAD3A-Myc mutant as indicated were double immunostained with anti-Myc antibody (green) and anti-ATP synthase F1 antibody (red) (bar, 20 μm). In the right panels are high-magnification observations of ROI (squared area) shown in left panel (bar, 2 μm). An arrowhead points to a cell that over expresses the WA MiRet-Myc mutant, which induces mitochondrial aggregation. (b) Control and transfected U373 cells with plasmids encoding WA- or WB- ATAD3A-Myc mutants as indicated were lysed and Myc-tagged proteins were immunoprecipitated with anti-Myc antibody. Total lysates (input) and Myc immunoprecipitates (IP-Myc) were analyzed by immunoblotting with anti-ATAD3A C-ter antibody. (c) U373 cells transfected with plasmids encoding WA- or WB-ATAD3A-Myc mutants as indicated were double immunostained with anti-ATAD3A C-ter (green) and anti-cis-Golgi GM130 protein (red) antibodies (upper panels; bar, 10 μm). High-magnification observations of squared areas (1 to 3) are also shown (lower panels; bar, 2 μm). (d) The bar graph shows the relative frequencies of tubular and fragmented mitochondria observed in transfected U373 cells expressing WA- or WB-ATAD3A-Myc mutants. Counts are representative of two independent experiments (200 cells scored per experiment). Only cells that demonstrated 4- to 5-fold expression of transfected proteins over endogenous wild-type protein were counted.
FIG. 8.
FIG. 8.
Mitochondrial fragmentation induced by WA ATAD3A mutant depends on the mitochondrial fission machinery. (a) U373 cells transfected with plasmids encoding WA ATAD3A-Myc for 20 h were labeled with MitoTracker CMXros (100 pM) for 2 h prior to fixation with methanol. Transfected cells were immunostained with anti-Myc antibody (green). (b) U373 cells transfected with plasmids encoding wild-type ATAD3A-Myc or WA ATAD3A-Myc mutant, as indicated, were double immunostained with anti-ATAD3A C-ter antibody (green) and anti-DNA antibody (red) (bar, 10 μm). High-magnification observations of ROI (i.e., the squared area) are shown in the left panels (bar, 2 μm). (c and d) U373 Cells were transfected with scrambled (control) or Drp1 siRNA oligonucleotides. After 72 h, the Drp1 and tubulin content in transfected cells was analyzed by immunoblotting on the same membrane (c). In panel d, transfected cells were further transfected with WA ATAD3A-Myc plasmid and double immunostained with anti-Myc (green) and anti-ATAD3A C-ter (red) antibodies. Bar, 20 μm.
FIG. 9.
FIG. 9.
Interaction of ATAD3A N termini with MOM is implicated in the control of the mitochondrial network. (a) Sucrose-density gradient profile of mitochondrial membrane fragments of cells transfected with WB-ATAD3A or WA-ATAD3A mutants. Fractions from top to bottom were analyzed by immunoblot with anti-ATAD3A C-ter and anti-prohibitin, an oligomeric protein anchored in the IM. (b) Control mitochondria (left panel) or mitochondria obtained from cells transfected with wild-type ATAD3A-Myc (lanes 1 to 3) or WA ATAD3A-Myc mutant (lanes 4 to 6) were left untreated or incubated with DTSSP for 2 min or 5 min as indicated. Mitochondrial proteins were separated on a 6% PAGE and analyzed by immunoblot with anti-C-ter (left panel) or anti-Myc antibodies (right panel). Asterisks indicate position of cross-linked hetero-oligomers with endogenous ATAD3A. (c and d) Truncated Δ50ATAD3A-Myc mutant behaves as dominant negative. (c) Control and transfected U373 cells with plasmids encoding wild-type- or Δ50-ATAD3A-Myc as indicated were lysed and Myc-tagged proteins were immunoprecipitated with Myc antibody. Total lysates (input) and Myc immunoprecipitates (IP-Myc) were analyzed by immunoblot with anti-Myc (left panel) and anti-ATAD3A N-ter (right panel) antibody. Δ50ATAD3A-Myc protein is not recognized by anti-ATAD3A N-ter antibody. (d) U373 cells transfected with plasmids encoding Δ50ATAD3A-Myc mutant were double immunostained with anti-ATAD3A C-ter antibody (green) and anti-GM130 antibody (red). Cells were observed by confocal microscopy at low magnification (bar, 20 μm). High-magnification observations of ROI (squared areas 1 and 2) are representative of a control cell (area 1) and a transfected cell (area 2).
FIG. 10.
FIG. 10.
Model for ATAD3A topology deduced from trypsin digestion experiments. (a) Schematic representation of ATAD3A at contact sites between the OM and IM. ATAD3A is shown as a dimer, but higher oligomers are likely through association of the C termini AAA-ATPase module as ring-shaped oligomer. (b) Schematic representation of ATAD3A* fragment resulting from mild proteolysis in isotonic buffer plus digitonin. (c) Schematic representation of ΔN-ATAD3A fragment resulting from mild proteolysis in hypotonic swelling condition.

Similar articles

Cited by

References

    1. Babst, M., B. Wendland, E. J. Estepa, and S. D. Emr. 1998. The Vps4p AAA ATPase regulates membrane association of a Vps protein complex required for normal endosome function. EMBO J. 17:2982-2993. - PMC - PubMed
    1. Bieniossek, C., T. Schalch, M. Bumann, M. Meister, R. Meier, and U. Baumann. 2006. The molecular architecture of the metalloprotease FtsH. Proc. Natl. Acad. Sci. U. S. A. 103:3066-3071. - PMC - PubMed
    1. Bird, I. M., N. A. Hanley, R. A. Word, J. M. Mathis, J. L. McCarthy, J. I. Mason, and W. E. Rainey. 1993. Human NCI-H295 adrenocortical carcinoma cells: a model for angiotensin-II-responsive aldosterone secretion. Endocrinology 133:1555-1561. - PubMed
    1. Bogenhagen, D. F., D. Rousseau, and S. Burke. 2008. The layered structure of human mitochondrial DNA nucleoids. J. Biol. Chem. 283:3665-3675. - PubMed
    1. Boldogh, I. R., and L. A. Pon. 2007. Mitochondria on the move. Trends Cell Biol. 17:502-510. - PubMed

Publication types

MeSH terms

LinkOut - more resources