. 2010 Apr 22;115(16):3239-48.
doi: 10.1182/blood-2009-09-246173. Epub 2010 Feb 12.

Impact of interactions of cellular components of the bone marrow microenvironment on hematopoietic stem and progenitor cell function

Affiliations

Impact of interactions of cellular components of the bone marrow microenvironment on hematopoietic stem and progenitor cell function

Brahmananda R Chitteti et al. Blood. .

Abstract

Hematopoietic stem (HSC) and progenitor (HPC) cell fate is governed by intrinsic and extrinsic parameters. We examined the impact of hematopoietic niche elements on HSC and HPC function by analyzing the combined effect of osteoblasts (OBs) and stromal cells (SCs) on Lineage(-)Sca-1(+)CD117(+) (LSK) cells. CFU expansion and marrow repopulating potential of cultured Lineage(-)Sca-1(+)CD117(+) cells were significantly higher in OB compared with SC cultures, thus corroborating the importance of OBs in the competence of the hematopoietic niche. OB-mediated enhancement of HSC and HPC function was reduced in cocultures of OBs and SCs, suggesting that SCs suppressed the OB-mediated hematopoiesis-enhancing activity. Although the suppressive effect of SC was mediated by adipocytes, probably through up-regulation of neuropilin-1, the OB-mediated enhanced hematopoiesis function was elaborated through Notch signaling. Expression of Notch 2, Jagged 1 and 2, Delta 1 and 4, Hes 1 and 5, and Deltex was increased in OB cultures and suppressed in SC and OB/SC cultures. Phenotypic fractionation of OBs did not segregate the hematopoiesis-enhancing activity but demonstrated that this function is common to OBs from different anatomic sites. These data illustrate that OBs promote in vitro maintenance of hematopoietic functions, including repopulating potential by up-regulating Notch-mediated signaling between HSCs and OBs.


Figures
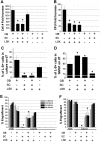
Figure 1
Figure 1
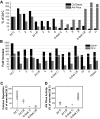
Impact of OB, SC, and OB + SC cocultures on stem and progenitor cell function. (A) Cells were cultured in different combinations as indicated, and all wells received recombinant murine stem cell factor and interleukin-3 (10 ng/mL), insulin-like growth factor 1 and thrombopoietin (20 ng/mL), interleukin-6 and Fms-like tyrosine kinase 3 (25 ng/mL), and OPN (50 ng/mL). Cells were harvested on day 7 and counted. Fold increase in total cell number from the original 1000 LSK cells was calculated relative to day 0; n = 6 to 8 independent experiments. (B) LSK progeny cells harvested on day 7 were plated in methylcellulose-based clonogenic assays, and colony formation was assessed 7 days later. CFU fold increase was calculated relative to that obtained from 250 freshly isolated LSK cells assayed on day 0; n = 4 or 5 independent experiments. (C) LSK progeny harvested on day 7 were stained and analyzed for the LinSca1+ content; n = 3 independent experiments. (D) LinSca1+ cells were sorted from each group and analyzed for cell-cycle status with propidium iodide; n = 5 independent experiments. (E) BM repopulating potential of freshly isolated and in vitro expanded LSK cells for 10 days in cocultures of OBs, SCs, or OBs + SCs or on plastic. LSK cells from C57Bl/6 (CD45.2) mice were cotransplanted with 100 000 BoyJ (CD45.1) competitor cells in lethally irradiated (1100 cGy, split dose) CD45.2 × CD45.1 F1 recipients. Control mice (Fresh) received 1000 freshly isolated LSK cells and 100 000 competitor cells. At monthly intervals, chimerism was assessed as [CD45.2/(CD45.2 + CD45.1)] × 100, thus eliminating the contribution of residual host-derived HSCs. Data are from 1 experiment, 4 or 5 mice per group, except for the LSK cells cultured on plastic where only 1 mouse survived. (F) Secondary transplantations from primary recipients. At 4 months after primary transplantation, the BM content of 1 femur from each primary recipient was transplanted into a lethally irradiated secondary recipient without competitor cells, and engraftment was assessed at monthly intervals. Each group contained 4 mice, except the LSK cells group, which had 2 mice transplanted with cells from a single primary recipient. *Significant at P < .01 compared with OB + LSK group for panels A, B, C, and D and at P < .05 for panels E and F. Differences between fresh and OB + LSK groups for primary and secondary transplantations were not significant.
Figure 2
Figure 2
Impact of Notch signaling inhibition on OB-mediated enhancement of HPC function. Increase in total cell number from the original 1000 LSK cells (A) and production of CFU (B) in cocultures of OB, SC, and LSK cells with and without the Notch inhibitor, GSI. Cell numbers and CFU content were assayed, and fold increase was calculated to day 0 values. Data shown are from 1 of 3 independent experiments with similar results. GSI was added at 10nM on day 0 and replenished twice during the next 7-day culture period. #P < .01, comparisons within each group between treatments with and without GSI. +P < .01 compared with OB + LSK group without GSI. *P < .05 compared with OB + LSK with GSI.
Figure 3
Figure 3
Notch activation in OB, SC, and LSK cocultures. (A) Endogenous expression of components of the Notch pathway. Quantitative RT-PCR was performed on cDNA generated from mRNA derived from sorted LSK cells, cultured SCs, and freshly isolated 2-day C OBs (performed in triplicate for each sample). Bar graphs represent ratio of each specific transcript to glyceraldehyde-3-phosphate dehydrogenase. Expression of each transcript in OBs and SCs was expressed as fold change relative to the expression of that transcript in LSK cells, which was normalized to 1. (B) Quantitative RT-PCR data from cells isolated from cocultures. Cocultures were established with SCs from C57Bl/6 GFP mice (CD45.2), OBs (2-day C) from C57Bl/6 mice (CD45.2), and LSK cells from BoyJ mice (CD45.1). On day 7, cells were harvested and stained with PE-CD45.1. mRNA was prepared from GFP-CD45.1+ cells (LSK progeny only) and analyzed. Bar graphs show fold increase in the expression of the indicated genes in LSK cultured alone (normalized to 1 in cultures without GSI) or with other cell types shown for each condition in parentheses. Quantitative RT-PCR was performed in triplicates for each sample and each condition. Data are representative of 2 independent experiments with similar results. GSI was added at 10nM on day 0 and replenished twice during the next 7-day culture period. The legend shown in the plot of Deltex in panel B applies to all other plots in the figure (N1, N2, J1, J2, and Hes1).
Figure 4
Figure 4
Impact of adipocytes on the maintenance of HPCs in vitro. Without frequent media changes and at high cell density, GZL, an established MSC cell line, differentiates preferentially into adipocytes (GZL/Adi). The number of adipocytes is greatly reduced when the cells are propagated under more favorable conditions (GZL). Both GZL and GZL/Adi were used along with primary SCs to sustain LSK cells for 7 days. (A) Cells were harvested on day 7, counted, and used in clonogenic assays. (B) SC, GZL, and GZL/Adi were assayed by quantitative RT-PCR for the expression of adiponectin and FABP4 as indicators of adipogenic differentiation. Data were normalized to primary SCs. (C) SCs, GZL, and GZL/Adi were separated from LSK progeny on day 7 by cell sorting and assayed by quantitative RT-PCR for the expression of neuropilin-1. Expression of Np1 was normalized to primary SCs. P < .05 between SC and GZL/Adi groups in panel A.
Figure 5
Figure 5
Effect of phenotypically defined groups of 2-day C OBs on HPC function. (A) Two-day C OBs were stained as described in “Methods.” Gated CD45CD31Ter119 cells were separated into Sca1ALCAM+ and Sca1ALCAM cells, which were used in assays shown in panel B. (B) Increase in cell number from the original LSK cells and production of clonogenic progenitors in the presence of phenotypically defined groups of OBs. +P < .01 compared with fold increase in cell number in calvarial OB cultures. *P < .01 compared with fold increase in CFU in calvarial OB cultures.
Figure 6
Figure 6
Phenotypic analysis of OBs from calvariae (C) or long bones (LB) of newborn (2-day) and 6- to 8-week-old mice. OBs were stained as described in “Cell staining and flow cytometry.” Cells were analyzed for Sca1 versus CD45/CD31/Ter119 (top row), and double-negative cells were then analyzed for OPN versus ALCAM (bottom row). Different numbers of events were collected and are displayed for each file. Sort gates defining groups 1 through 11 were established based on fluorescence levels of control samples. Cells in these gates were sorted and used in different assays depending on the number of cells recovered for each fraction. Dot plots are from 1 representative experiment of 3.
Figure 7
Figure 7
Osteogenic and hematopoietic functional studies of isolated fractions of OBs. (A) Ca deposition and enzymatic ALP activity of parental populations and groups 1 through 11 shown in Figure 6. Cells were cultured in osteogenic media (αminimal essential medium supplemented with 10% fetal calf serum, 50 μg/mL ascorbic acid, 2 times per week). Starting on day 7, cultures were supplemented with 5mM β-glycerophosphate to induce mineralization and were assayed on day 14. ALP activity and Ca deposition were assessed as described in “ALP activity” and “Quantitative analysis of Ca deposition.” With the exception of the unsorted 2-day C and 2-day LB data (n = 3 in duplicate), results are from 2 experiments each performed in duplicate. (B) Parental populations and cell fractions collected in sufficient numbers were used in cocultures with LSK cells. Cultured cells were harvested on day 7, counted, and assayed for HPC content performed in triplicate. Data shown were collected from 2 sorting experiments. (C-D) Results from Ca deposition (C) and enzymatic ALP activity (D) from 2-day C, 2-day LB, 6- to 8-week C, and 6- to 8-week LB (n = 6-8 for all groups) are reported as box plots depicting the range of data points and the mean (line). Error bars represent SD associated with the mean. Data points more than 2 SD from the mean are identified on the plot and were still used in statistical determinations. Statistical analysis methods used to analyze data shown in panels C and D are described in “Statistical analysis.”

Similar articles

Cited by

References

    1. Raaijmakers MH, Scadden DT. Evolving concepts on the microenvironmental niche for hematopoietic stem cells. Curr Opin Hematol. 2008;15(4):301–306. - PubMed
    1. Haylock DN, Williams B, Johnston HM, et al. Hemopoietic stem cells with higher hemopoietic potential reside at the bone marrow endosteum. Stem Cells. 2007;25(4):1062–1069. - PubMed
    1. Mayack SR, Wagers AJ. Osteolineage niche cells initiate hematopoietic stem cell mobilization. Blood. 2008;112(3):519–531. - PMC - PubMed
    1. Marusić A, Kalinowski JF, Jastrzebski S, Lorenzo JA. Production of leukemia inhibitory factor mRNA and protein by malignant and immortalized bone cells. J Bone Miner Res. 1993;8(5):617–624. - PubMed
    1. Taichman RS, Emerson SG. Human osteoblasts support hematopoiesis through the production of granulocyte colony-stimulating factor. J Exp Med. 1994;179(5):1677–1682. - PMC - PubMed

Publication types

MeSH terms

Substances