

Proteinase-activated receptor-2 up-regulation by Fcgamma-receptor activation in human neutrophils
- PMID: 20154268
- PMCID: PMC2881300
- DOI: 10.1096/fj.09-146167
Proteinase-activated receptor-2 up-regulation by Fcgamma-receptor activation in human neutrophils
Abstract
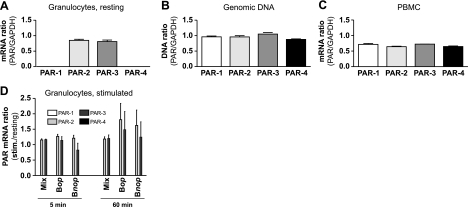
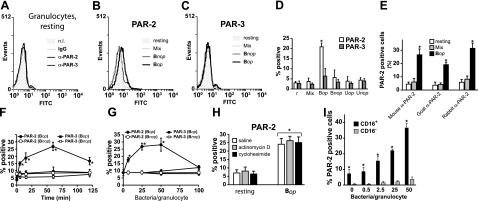
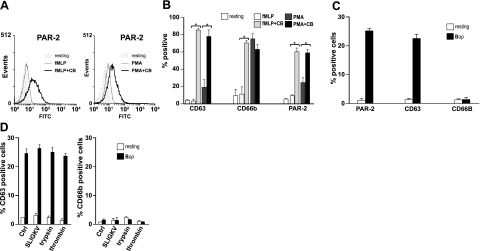
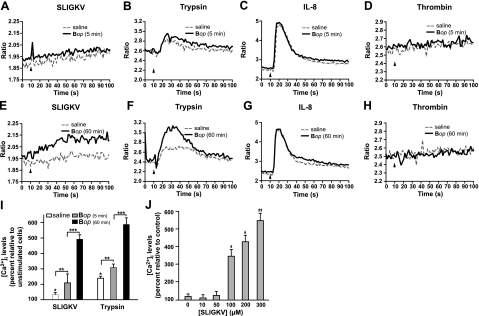
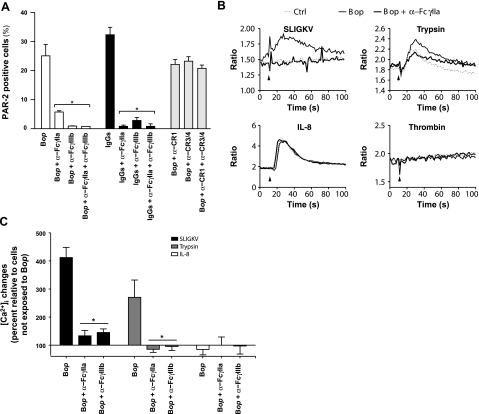
We shed new light on the expression and function of the proteinase-activated receptor (PAR) family, associated with inflammation and hyperalgesia, in human granulocytes. Resting cells expressed constitutive levels of PAR-2 and PAR-3 mRNA but not PAR-1 or PAR-4. Based on flow cytometry, stimulation with opsonized bacteria (Bop) specifically up-regulated cell surface expression of PAR-2 in a concentration-dependent and time-dependent manner, independent of transcription or de novo protein synthesis. Primary granules were identified as a source of preformed PAR-2 that can readily be mobilized at the surface on fusion with the plasma membrane. Cellular response to PAR-2 activation, measured as changes in intracellular calcium concentration, was enhanced in PAR-2 up-regulated cells. Increase of cell-surface PAR-2 and of cell responsiveness were dependent specifically on the engagement of immunoglobulin (Ig)-binding receptors. Together, our results reveal that mobilization of intracellular granules, in response to Ig-receptor activation, up-regulates PAR-2 surface expression and makes neutrophils more responsive to proteinase activity. This enhanced response to PAR-2 activation indicates that molecular communication between pain and inflammation may be more important than previously believed.
Figures
Similar articles
-
Signal of proteinase-activated receptor-2 contributes to highly malignant potential of human pancreatic cancer by up-regulation of interleukin-8 release.Int J Oncol. 2006 Apr;28(4):939-46. Int J Oncol. 2006. PMID: 16525644
-
Agonists of proteinase-activated receptor-2 affect transendothelial migration and apoptosis of human neutrophils.Exp Dermatol. 2007 Oct;16(10):799-806. doi: 10.1111/j.1600-0625.2007.00605.x. Exp Dermatol. 2007. PMID: 17845211
-
Proteinase-activated receptor-2 expression in breast cancer and the role of trypsin on growth and metabolism of breast cancer cell line MDA MB-231.Physiol Res. 2007;56(4):475-484. doi: 10.33549/physiolres.930959. Epub 2006 Aug 22. Physiol Res. 2007. PMID: 16925462
-
The house dust mite allergen Der p 1, unlike Der p 3, stimulates the expression of interleukin-8 in human airway epithelial cells via a proteinase-activated receptor-2-independent mechanism.J Biol Chem. 2006 Mar 17;281(11):6910-23. doi: 10.1074/jbc.M507140200. Epub 2005 Nov 17. J Biol Chem. 2006. PMID: 16293628
-
Activation of proteinase-activated receptor 2 in human osteoarthritic cartilage upregulates catabolic and proinflammatory pathways capable of inducing cartilage degradation: a basic science study.Arthritis Res Ther. 2007;9(6):R121. doi: 10.1186/ar2329. Arthritis Res Ther. 2007. PMID: 18031579 Free PMC article.
Cited by
-
Porphyromonas gingivalis promotes invasion of oral squamous cell carcinoma through induction of proMMP9 and its activation.Cell Microbiol. 2014 Jan;16(1):131-45. doi: 10.1111/cmi.12211. Epub 2013 Sep 19. Cell Microbiol. 2014. PMID: 23991831 Free PMC article.
-
Fc gammaRIIIb triggers raft-dependent calcium influx in IgG-mediated responses in human neutrophils.J Biol Chem. 2011 Feb 4;286(5):3509-19. doi: 10.1074/jbc.M110.169516. Epub 2010 Dec 1. J Biol Chem. 2011. PMID: 21123174 Free PMC article.
-
Activated protein C inhibits neutrophil extracellular trap formation in vitro and activation in vivo.J Biol Chem. 2017 May 26;292(21):8616-8629. doi: 10.1074/jbc.M116.768309. Epub 2017 Apr 13. J Biol Chem. 2017. PMID: 28408624 Free PMC article.
-
Involvement of protease-activated receptor 4 in over-expression of matrix metalloproteinase 9 induced by Porphyromonas gingivalis.Med Microbiol Immunol. 2015 Oct;204(5):605-12. doi: 10.1007/s00430-015-0389-y. Epub 2015 Feb 11. Med Microbiol Immunol. 2015. PMID: 25670650
-
Activation of the Coagulation Cascade as a Universal Danger Sign.Curr Issues Mol Biol. 2025 Feb 9;47(2):108. doi: 10.3390/cimb47020108. Curr Issues Mol Biol. 2025. PMID: 39996829 Free PMC article. Review.
References
-
- Coughlin S. R. Thrombin signalling and protease-activated receptors. Nature. 2000;407:258–264. - PubMed
-
- Ossovskaya V. S., Bunnett N. W. Protease-activated receptors: contribution to physiology and disease. Physiol Rev. 2004;84:579–621. - PubMed
-
- Uehara A., Sugawara Y., Sasano T., Takada H., Sugawara S. Proinflammatory cytokines induce proteinase 3 as membrane-bound and secretory forms in human oral epithelial cells and antibodies to proteinase 3 activate the cells through protease-activated receptor-2. J Immunol. 2004;173:4179–4189. - PubMed
-
- Sekiguchi F. Development of agonists/antagonists for protease-activated receptors (PARs) and the possible therapeutic application to gastrointestinal diseases. Yakugaku Zasshi. 2005;125:491–498. - PubMed
-
- Nakanishi-Matsui M., Zheng Y. W., Sulciner D. J., Weiss E. J., Ludeman M. J., Coughlin S. R. PAR3 is a cofactor for PAR4 activation by thrombin. Nature. 2000;404:609–613. - PubMed
Publication types
MeSH terms
Substances
Grants and funding
LinkOut - more resources
Full Text Sources
Other Literature Sources
