Genetic diversity and population structure in the tomato-like nightshades Solanum lycopersicoides and S. sitiens
- PMID: 20154348
- PMCID: PMC2850793
- DOI: 10.1093/aob/mcq009
Genetic diversity and population structure in the tomato-like nightshades Solanum lycopersicoides and S. sitiens
Abstract
Background and aims: Two closely related, wild tomato-like nightshade species, Solanum lycopersicoides and Solanum sitiens, inhabit a small area within the Atacama Desert region of Peru and Chile. Each species possesses unique traits, including abiotic and biotic stress tolerances, and can be hybridized with cultivated tomato. Conservation and utilization of these tomato relatives would benefit from an understanding of genetic diversity and relationships within and between populations.
Methods: Levels of genetic diversity and population genetic structure were investigated by genotyping representative accessions of each species with a set of simple sequence repeat (SSR) and allozyme markers.
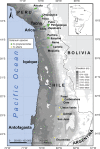
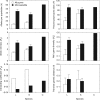
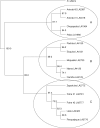
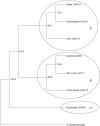
Key results: As expected for self-incompatible species, populations of S. lycopersicoides and S. sitiens were relatively diverse, but contained less diversity than the wild tomato Solanum chilense, a related allogamous species native to this region. Populations of S. lycopersicoides were slightly more diverse than populations of S. sitiens according to SSRs, but the opposite trend was found with allozymes. A higher coefficient of inbreeding was noted in S. sitiens. A pattern of isolation by distance was evident in both species, consistent with the highly fragmented nature of the populations in situ. The populations of each taxon showed strong geographical structure, with evidence for three major groups, corresponding to the northern, central and southern elements of their respective distributions.
Conclusions: This information should be useful for optimizing regeneration strategies, for sampling of the populations for genes of interest, and for guiding future in situ conservation efforts.
Figures


References
-
- Allendorf FW. Isolation, gene flow and genetic differentiation among populations. In: Schonewalk-Cox CM, Chambers SM, MacBryde B, Thomas L, editors. Genetics and conservation. London: Benjamin/Cummings; 1983. pp. 51–65.
-
- Alvarez AE, van de Wiel CCM, Smulders MJM, Vosman B. Use of microsatellites to evaluate genetic diversity and species relationships in the genus Lycopersicon. Theoretical and Applied Genetics. 2001;103:1283–1292.
-
- Avise JC. Molecular markers, natural history, and evolution. Sunderland, MA: Sinauer Associates, Inc. Publishers; 2004.
-
- Barton NH, Slatkin M. A quasi-equilibrium theory of the distribution of rare alleles in a subdivided population. Heredity. 1986;56:409–416. - PubMed
MeSH terms
LinkOut - more resources
Full Text Sources
Research Materials

