. 2010 Feb 13;17(2):117-29.
doi: 10.1101/lm.1585910. Print 2010 Feb.

Assessment of the role of MAP kinase in mediating activity-dependent transcriptional activation of the immediate early gene Arc/Arg3.1 in the dentate gyrus in vivo

Affiliations

Assessment of the role of MAP kinase in mediating activity-dependent transcriptional activation of the immediate early gene Arc/Arg3.1 in the dentate gyrus in vivo

Jennifer K Chotiner et al. Learn Mem. .

Abstract

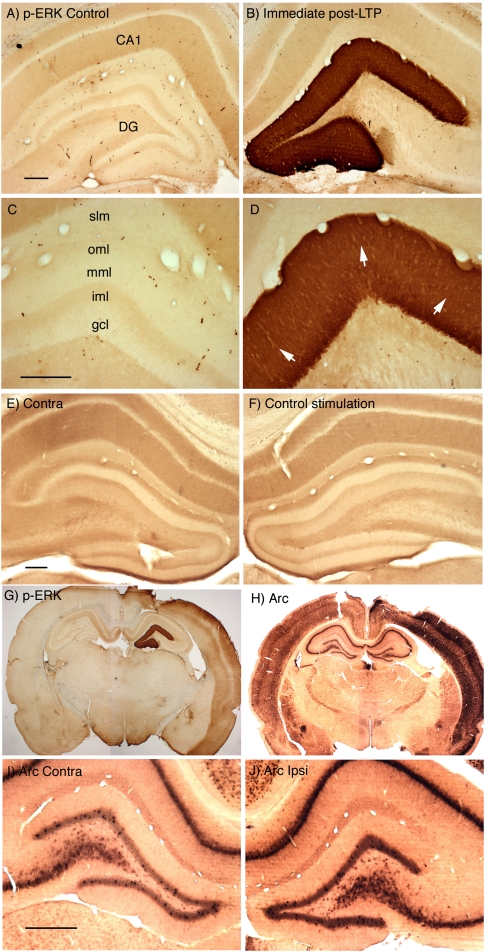
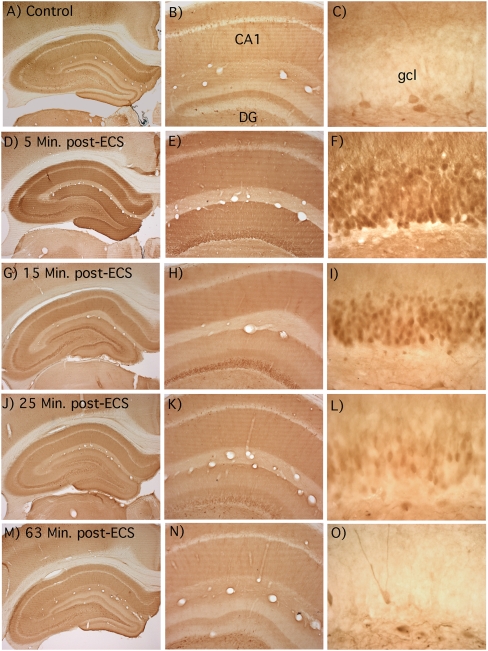
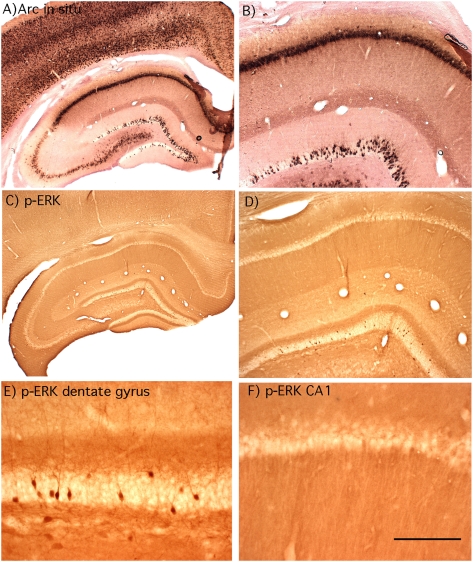
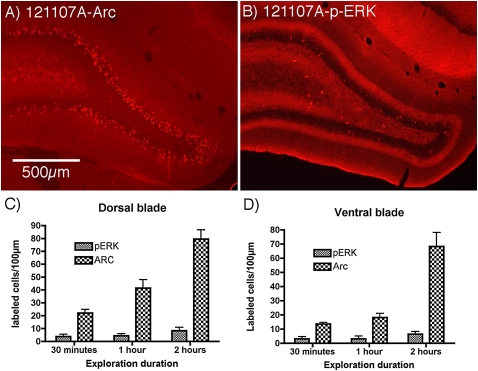
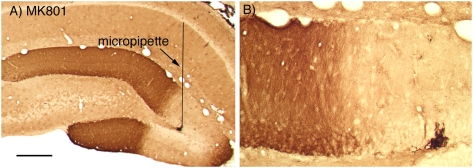
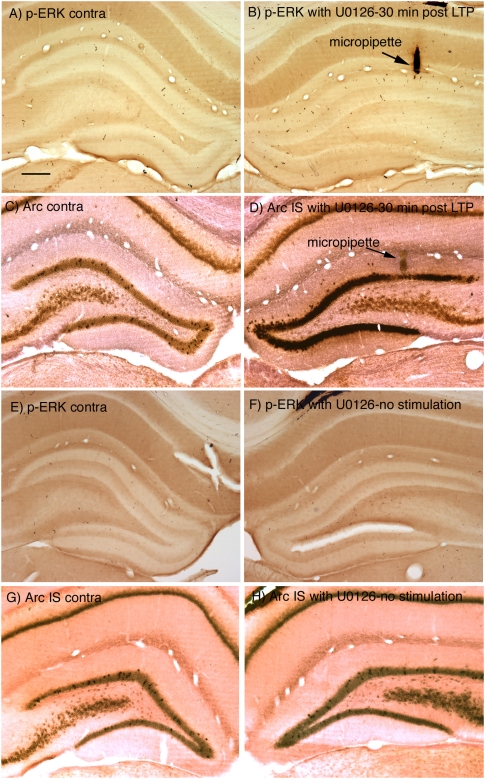
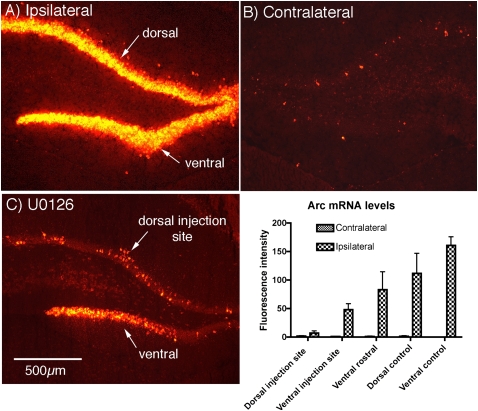
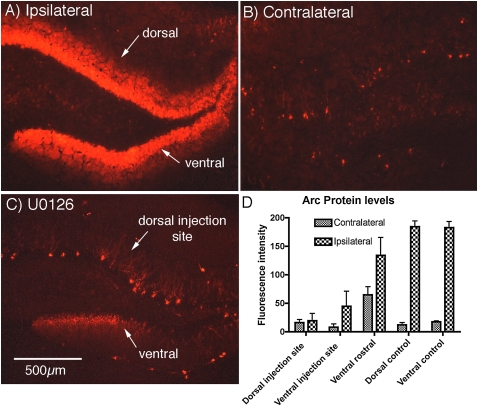
Different physiological and behavioral events activate transcription of Arc/Arg3.1 in neurons in vivo, but the signal transduction pathways that mediate induction in particular situations remain to be defined. Here, we explore the relationships between induction of Arc/Arg3.1 transcription in dentate granule cells in vivo and activation of mitogen-activated protein (MAP) kinase as measured by extracellular-regulated kinase 1/2 (ERK1/2) phosphorylation. We show that ERK1/2 phosphorylation is strongly induced in dentate granule cells within minutes after induction of perforant path long-term potentiation (LTP). Phospho-ERK staining appears in nuclei within minutes after stimulation commences, and ERK phosphorylation returns to control levels within 60 min. Electroconvulsive seizures, which strongly induce prolonged Arc/Arg3.1 transcription in dentate granule cells, induced ERK1/2 phosphorylation in granule cells that returned to control levels within 30 min. Following 30, 60, and 120 min of exploration in a novel complex environment, Arc/Arg3.1 transcription was activated in many more granule cells than stained positively for p-ERK at all time points. Although Arc/Arg3.1 transcription was induced in most pyramidal neurons in CA1 following exploration, very few pyramidal neurons exhibited nuclear p-ERK1/2 staining. Local delivery of U0126 during the induction of perforant path LTP blocked transcriptional activation of Arc/Arg3.1 in a small region near the injection site and blocked Arc/Arg3.1 protein expression over a wider region. Our results indicate that activation of Arc/Arg3.1 transcription in dentate granule cells in vivo is mediated in part by MAP kinase activation, but other signaling pathways also contribute, especially in the case of Arc/Arg3.1 induction in response to experience.


Figures

Figure 1.
Figure 1.
High-frequency synaptic activation triggers ERK phosphorylation (p-ERK) throughout the dendrites and cell bodies of dentate granule cells. (A–D) Pattern of immunostaining for p-ERK in rats in which the perforant path has been activated at high frequency to induce LTP. (A,C) Pattern of staining on the control side contralateral to the stimulation. (CA1) Ca1 region of the hippocampus; (DG) dentate gyrus; (gcl) granule cell layer; (iml) inner molecular layer; (mml) middle molecular layer; (oml) outer molecular layer; (slm) stratum lacunosum-moleculare of the hippocampus. (B,D) Pattern of staining on the side that received three rounds of 10 400-Hz trains, each of which was followed by 10 test pulses (a total of 30 trains and 30 test pulses). Trains and test stimulation were delivered at 1/10 sec intervals, so that the entire induction protocol required 10 min. Animals were perfused ∼2 min after the end of the third test period, which was ∼4 min after the last high-frequency train. Note striking activation of ERK phosphorylation throughout the dendritic and cell body laminae of the dentate gyrus. White arrows in D indicate the band of staining in the activated lamina. (E,F) Pattern of immunostaining for p-ERK is not altered by stimulation that does not induce LTP. Here, the rat received test stimulation and then 15 min of paired-pulse stimulation. Note that immunostaining for p-ERK was comparable on stimulated (E) and control (F) sides. (G) Induction of ERK phosphorylation throughout the neocortex on the side on which stimulating and recording electrodes had been placed. This is the same animal shown in A–D. (H) The strong induction of Arc/Arg3.1 expression throughout the neocortex as revealed by in situ hybridization for Arc/Arg3.1 mRNA. (I,J) Minimal induction of Arc/Arg3.1 mRNA expression in dentate granule cells 12 min after the start of the HFS. Scale bars, 250 μm.
Figure 2.
Figure 2.
Time course of induction of ERK phosphorylation after induction of perforant path LTP. (A) Photomicrographs of immunostained sections from rats killed at various time points after one (5-min) or three (10-, 15-, 30-, and 60-min) rounds of HFS, as indicated at the top of each column. (Top) The dentate gyrus, with surrounding hippocampus, of the stimulated (ipsilateral) side. (Bottom) A higher magnification view of the dorsal blade of the dentate gyrus. Note that at 5 min after stimulation, no staining of p-ERK is seen in the nuclei, while at 10, 15, and 30 min, the cell bodies and nuclei are heavily stained. The pattern of staining at 60 min is comparable with what is seen on the control side (see Fig. 1A). (B) Graphs of the average optical density (OD) across the ipsilateral (stimulated) and contralateral (nonstimulated) dorsal blade at each time point. Each row number represents a particular row along the blade, as indicated in the 5-min, 20× photo of A. Note that in the 5-min group, staining density is relatively uniform across cell body and molecular layers, whereas in the 10- and 15-min groups, staining is more intense in the cell body layer.
Figure 3.
Figure 3.
Time course and stimulation requirements for the nuclear localization of p-ERK after HFS of the perforant path. The photomicrographs illustrate the pattern of immunostaining for p-ERK in the control dentate gyrus and after various periods of HFS. (A) Pattern of immunostaining in the unstimulated (control) dentate gyrus. The stick drawing illustrates the distribution of granule cell bodies and dendrites. (B) Five min after a single bout of 10 trains (which is not sufficient to induce persistent LTP), nuclei exhibited low levels of staining in comparison with the surrounding cytoplasm. (C) Ten min after three bouts of HFS (30 trains), nuclear staining is prominent. (D) Immunostaining after 30 high-frequency trains delivered at a rate of 1/10 sec over a period of 5 min without intervening test stimulation; the animal was perfused ∼2 min after the end of the stimulation period. Many nuclei exhibit high levels of immunostaining. (E) Immunostaining after delivering HFS for 1 h at a rate of 1/10 sec.
Figure 4.
Figure 4.
Time course of ERK activation after a single ECS showing the patterns of immunostaining in rats that received an ECS and were killed 5, 15, 25, and ∼60 min post-seizure and in a control animal that was brought into the room in the same cage but did not receive an ECS. (A–C) Control; (D–F) 5 min post-ECS. Note that the tri-laminar staining pattern typical of awake nonstimulated control rats (A–C) was replaced by a uniformly increased staining throughout the molecular layer and cell body layer of the dentate gyrus. Note also prominent nuclear staining for p-ERK in dentate granule cells. (G–I) Fifteen min post-ECS. The overall level of staining in the molecular layer was less, so the normal trilaminar staining pattern was discernable, but nuclei remained darkly stained. (J–L) Twenty-five min post-ECS. Overall staining in the molecular layer was similar to control, and nuclear staining was less striking than at 15 min. (M–O) Sixty-three min post-ECS. The pattern of staining in the molecular and granule layers was comparable with the control, although neurons in the hilus continued to show high levels of p-ERK staining.
Figure 5.
Figure 5.
Arc/Arg3.1 transcription and MAP kinase activation following 2-h exploration of a complex novel environment: Animal #121107A. (A,B) Pattern of labeling for Arc/Arg3.1 mRNA. Note the induction of Arc/Arg3.1 expression in many granule cells scattered through the dentate gyrus and that Arc/Arg3.1 mRNA is induced in virtually every pyramidal neuron in CA1. (C–F) Pattern of immunostaining for p-ERK. Note that the laminated pattern of staining is generally comparable with that seen in awake cage control rats, but that neurons scattered through the granule cell layer exhibit high levels of p-ERK staining. Some hippocampal neurons in CA1 exhibit cytoplasmic staining for p-ERK, but very few exhibit nuclear staining, and none exhibit the high levels of staining seen in dentate granule cells.
Figure 6.
Figure 6.
Comparison of Arc induction and MAP kinase activation following different periods of exploration of a complex novel environment. (A) Pattern of immunostaining for Arc protein after 2 h of exploration in the novel complex environment as revealed by immunofluorescence; note the large numbers of Arc-positive granule cells. This is from the same animal as shown in Figure 5 (#121107A). (B) Pattern of immunostaining for p-ERK in the same animal; note that only a few granule cells exhibit staining for p-ERK. (C,D) Graphs illustrating counts of the number of p-ERK-positive (C) and Arc-positive (D) granule cells in the dorsal and ventral blade, respectively, after 30 min, 1 h, and 2 h of exploration in the novel complex environment (n = 4 at 30 min; n = 3 at 1 h; n = 4 at 2 h). Analyses by ANOVA revealed significant differences over time and in numbers of Arc positive vs. p-ERK positive cells both dorsal and ventral blades (P < 0.001 for both). Comparisons of numbers of p-ERK positive vs. Arc positive neurons by paired t-test revealed significant differences at all time points. (Thirty min dorsal blade: t = 4.62, P < 0.002; ventral blade: t = 4.98, P < 0.02; 1 h: dorsal blade t = 4.92, P < 0.04; ventral blade: t = 4.23, P < 0.05; 2 h: dorsal blade t = 10.58, P < 0.002; ventral blade: t = 5.231, P < 0.014.)
Figure 7.
Figure 7.
Blockade of ERK phosphorylation by MK801. Pattern of immunostaining for p-ERK when a micropipette filled with MK801 (10 mg/mL in saline) was positioned in the dentate gyrus during the induction of perforant path LTP. Similar results were seen in six experiments.
Figure 8.
Figure 8.
Blockade of ERK activation attenuates Arc/Arg3.1 transcription. (A–D) p-ERK immunostaining and Arc/Arg3.1 mRNA levels 30 min after LTP initiation when U0126 was present in the micropipette. (A) p-ERK on the side contralateral to the stimulation; (B) p-ERK on the stimulated side when U0126 was present in the micropipette. Note the blockade of ERK phosphorylation on the stimulated side (cf. Fig. 1A). The micropipette track is indicated by the arrow. (C) Arc/Arg3.1 mRNA on the side contralateral to the stimulation; (D) Arc/Arg3.1 mRNA on the stimulated side when U0126 was present in the micropipette. (E,F) Absence of induction of ERK phosphorylation when a U0126 micropipette was present in the dentate gyrus, but no stimulation was delivered. (G,H) Absence of induction of Arc/Arg3.1 mRNA when a U0126 micropipette was present in the dentate gyrus, but no stimulation was delivered. Scale bar, 250 μm, applies to all panels.
Figure 9.
Figure 9.
Quantitative assessment of U0126 blockade of Arc/Arg3.1 induction using FISH. (A) Induction of Arc/Arg3.1 mRNA in the dentate gyrus 30 min after inducing perforant path LTP. (B) Contralateral (control) side of the same animal. (C) Attenuation of induction of Arc/Arg3.1 mRNA in the area surrounding a U0126-filled micropipette. Note reduced labeling for Arc/Arg3.1 mRNA throughout the dorsal blade and strong induction in the ventral blade at a distance from the micropipette tip. The small cluster of Arc/Arg3.1-positive granule cells is at the tip of the micropipette. Similar small clusters of Arc/Arg3.1 positive neurons are usually seen at the tip of a recording micropipette. The graph illustrates the results of a quantitative analysis of Arc/Arg3.1 mRNA fluorescence at the injection site in the dorsal blade (dorsal injection site), the ventral blade of the same section (ventral injection site), in the ventral blade ∼1–2 mm rostral to the micropipette, and in dorsal and ventral blades of sections from three rats that received HFS in the absence of U0126 (dorsal control and ventral control). Also shown are the values for average fluorescence intensity in similar locations on the contralateral side of the brain that did not receive stimulation. Statistical comparisons were by t-test (n = 3 control; n = 3 treated with U0126); Arc/Arg3.1 mRNA levels were significantly lower in both the dorsal blade near the U0126-containing micropipette and in the ventral blade of the same section (P < 0.004 for both).
Figure 10.
Figure 10.
Blockade of ERK activation blocks induction of IEG protein expression. The panels illustrate the pattern of immunostaining for p-ERK, Arc/Arg3.1 protein, and c-fos protein 30 min after HFS of the perforant path when UO 126 was present in the recording micropipette. (A,B) Immunostaining for p-ERK contralateral (A) and ipsilateral (B) to the HFS. Note the blockade of ERK phosphorylation on the stimulated side (cf. Fig. 1A). (C,D) Immunostaining for Arc/Arg3.1 protein contralateral (C) and ipsilateral (D) to the HFS. Note the blockade of induction of Arc/Arg3.1 protein, especially in the dorsal blade of the dentate gyrus. (E,F) Immunostaining for c-fos contralateral (E) and ipsilateral (F) to the HFS. Note the blockade of induction of c-fos protein, especially in the dorsal blade of the dentate gyrus. The high-power micrographs in G and H are taken at the sites indicated by “g” and “h” in F. (I) Strong induction of c-fos protein expression in the anterior portion of the hippocampus distant from the U0126-containing micropipette. Scale bar in A, 500 μm, applies to A–F.
Figure 11.
Figure 11.
Quantitative assessment of U0126 blockade of Arc/Arg3.1 protein induction using immunofluorescence. The graph illustrates the results of a quantitative analysis of Arc immunofluorescence at the injection site in the dorsal blade (dorsal injection site), the ventral blade of the same section (ventral injection site), and in dorsal and ventral blades of sections from three rats that received HFS in the absence of U0126 (dorsal control and ventral control). These are the same cases in which Arc mRNA levels were quantitatively assessed in Figure 9. Also shown are the values for average fluorescence intensity in similar locations on the contralateral side of the brain that did not receive stimulation. Quantitative analysis of fluorescence revealed blockade of Arc induction in both dorsal and ventral blades at the level of the U0126 injection, whereas induction of Arc mRNA in the same cases was blocked only in the dorsal blade very near the injection (cf. Fig. 11 with Fig. 9).

Similar articles

Cited by

References

    1. Chawla MK, Guzowski JF, Ramirez-Amaya V, Lipa P, Hoffman KL, Marriott LK, Worley PF, McNaughton BL, Barnes CA. Sparse, environmentally selective expression of Arc RNA in the upper blade of the rodent fascia dentata by brief spatial experience. Hippocampus. 2005;10:579–586. - PubMed
    1. Coogan AN, O'Leary DM, O'Connor JJ. P42/44 MAP kinase inhibitor PD98059 attenuates multiple forms of synaptic plasticity in rat dentate gyrus in vitro. J Neurophysiol. 1999;81:103–110. - PubMed
    1. Davis S, Vanhoutte P, Pages C, Caboche J, Laroche S. The MAPK/ERK cascade targets both Elk-1 and cAMP response element-binding protein to control long-term potentiation-dependent gene expression in the dentate gyrus in vivo. J Neurosci. 2000;20:4563–4572. - PMC - PubMed
    1. Dudek SM, Fields RD. Mitogen-activated protein kinase/extracellular signal-regulated kinase activation in somatodendritic compartments: Roles of action potentials, frequency, and mode of calcium entry. J Neurosci. 2001;21:RC122. - PMC - PubMed
    1. Gallagher SM, Daly CA, Bear MF, Huber KM. Extracellular signal-regulated protein kinase activation is required for metabotropic glutamate receptor-dependent long-term depression in hippocampal area CA1. J Neurosci. 2004;24:4859–4864. - PMC - PubMed

Publication types

MeSH terms

Substances

LinkOut - more resources