. 2010 Jul;51(7):1906-17.
doi: 10.1194/jlr.M005447. Epub 2010 Feb 14.

Inflammation and insulin resistance induced by trans-10, cis-12 conjugated linoleic acid depend on intracellular calcium levels in primary cultures of human adipocytes

Affiliations

Inflammation and insulin resistance induced by trans-10, cis-12 conjugated linoleic acid depend on intracellular calcium levels in primary cultures of human adipocytes

Arion Kennedy et al. J Lipid Res. 2010 Jul.

Abstract

We previously demonstrated that trans-10, cis-12 (10,12) conjugated linoleic acid (CLA) induced inflammation and insulin resistance in primary human adipocytes by activating nuclear factor kappaB (NFkappaB) and extracellular signal-related kinase (ERK) signaling. In this study, we demonstrated that the initial increase in intracellular calcium ([Ca2+]i) mediated by 10,12 CLA was attenuated by TMB-8, an inhibitor of calcium release from the endoplasmic reticulum (ER), by BAPTA, an intracellular calcium chelator, and by D609, a phospholipase C (PLC) inhibitor. Moreover, BAPTA, TMB-8, and D609 attenuated 10,12 CLA-mediated production of reactive oxygen species (ROS), activation of ERK1/2 and cJun-NH2-terminal kinase (JNK), and induction of inflammatory genes. 10,12 CLA-mediated binding of NFkappaB to the promoters of interleukin (IL)-8 and cyclooxygenase (COX)-2 and induction of calcium-calmodulin kinase II (CaMKII) beta were attenuated by TMB-8. KN-62, a CaMKII inhibitor, also suppressed 10,12 CLA-mediated ROS production and ERK1/2 and JNK activation. Additionally, KN-62 attenuated 10,12 CLA induction of inflammatory and integrated stress response genes, increase in prostaglandin F2alpha, and suppression of peroxisome proliferator activated receptor gamma protein levels and insulin-stimulated glucose uptake. These data suggest that 10,12 CLA increases inflammation and insulin resistance in human adipocytes, in part by increasing [Ca2+]i levels, particularly calcium from the ER.


Figures

Fig. 1.
Fig. 1.
10,12 CLA increases [Ca2+]i in an isomer-specific and dose-dependent manner. Cultures of newly differentiated human adipocytes were preloaded with 5 μM Fluo-3 AM. A: Cultures were injected with vehicle (−), or 0.3, 0.6, 1.2, or 2.4 μM thapsigargin (Tg; triangle up filled), a positive control that causes the release of calcium from the ER. B: Cultures were injected with vehicle (−); 5 μM Tg (triangle up filled); 50, 100, or 150 μM 10,12 CLA (circle filled); or 50, 100, or 150 μM 9,11 CLA (star filled). The line graph on the left shows the time course for [Ca2+]i, and bar graphs on the right show the peak [Ca2+]i levels at the 3 and 8 min treatment times. C: Cultures were injected with vehicle (−), Tg (triangle up filled); 150 μM 10,12 CLA (circle filled); 100 μM TMB-8 (blocks ER calcium release) + 5 μM Tg (triangle up open); or 100 μM TMB-8 + 150 μM 10,12 CLA (circle open). D: Cultures were injected with vehicle (−); 5 μM Tg (triangle up filled); 150 μM 10,12 CLA (circle filled); 10 μM BAPTA (an intracellular calcium chelator) + Tg (triangle up open); or 10 μM BAPTA+ 150 μM 10,12 CLA (circle open). E: Cultures were injected with vehicle (−); 5 μM Tg (triangle up filled), 150 μM 10,12 CLA (circle filled), 100 μM EGTA (extracellular calcium chelator) + Tg (triangle up open), or 100 μM EGTA + 150 μM 10,12 CLA (circle open). F: Cultures were injected with vehicle (−), 5 μM Tg (triangle up filled), or 150 μM 10,12 CLA (circle filled), or pretreated for 7 min with 5 μM Tg followed by a second treatment with 5 μM Tg (triangle up open) or 150 μM 10,12 CLA (circle open) (left side) and vice-versa (right side) to determine the extent to which CLA causes calcium release specifically from the ER. Emitted fluorescence intensities were collected over time using a multidetection microplate reader. Excitation wavelength was 485 nm, and fluorescence was collected at 528 nm. Means (± SEM; n = 4–6) in all panels are representative of at least three independent experiments.
Fig. 2.
Fig. 2.
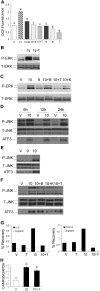
10,12 CLA increase of ROS, ERK, JNK, ATF3, and NFκB are attenuated by BAPTA, TMB-8, or KN-62. Cultures of newly differentiated human adipocytes were serum-starved 24 h and then treated with CLA, the calcium chelators, or inhibitors. A: Cultures were preloaded with DCF for 1 h, pretreated for 1 h with 2 μM BAPTA (B), 10 μM KN-62 (K), or 100 μM TMB-8 (T), and then treated with BSA vehicle (V) or 50 μM 10,12 CLA (10) for 3 h. Emitted fluorescence intensities were measured using a multidetection microplate reader. Excitation wavelength was 485 nm and fluorescence was collected at 528 nm. One-way ANOVA was used to compare data. Means (± SEM; n = 12) that do not share a common lower case letter differ (P < 0.05). B: Cultures were treated for 12 h with 30 nM thapsigargin (Tg) in the absence or presence of TMB-8 (T). C: Cultures were treated for 12 h with BSA vehicle (V), 50 μM 10,12 CLA alone (10), 50 μM 9,11 CLA alone (9), or 50 μM 10,12 CLA in the presence of 2 μM BAPTA (10+B), 10 μM KN-62 (10+K), or 100 μM TMB-8 (10+T). Proteins were then harvested, subjected to electrophoresis, and immunoblotted for p-ERK and total ERK. D: Cultures were treated with BSA vehicle (V) or 50 μM 10,12 CLA (10) for 6, 12, or 24 h and then immunoblotted for p-JNK, total JNK and ATF3. E, Cultures were treated for 12 h with BSA vehicle (V) 50 μM 9,11CLA (9), or 50 μM 10,12 CLA (10) and immunoblotted as in D. F: Cultures were treated for 12 h with BSA vehicle (V) or 50 μM 10,12 CLA (10) alone or 10,12 CLA in the presence of 2 μM BAPTA (10+B), 10 μM KN-62 (10+K), or 100 μM TMB-8 (10+T) and immunoblotted as in D. G: Cultures of newly differentiated SGBS cells were treated for approximately 10 h with BSA vehicle (V), 30 μM 10,12 CLA (10) in the absence or presence of 100 μM TMB-8 (T). ChIP assays quantified DNA-binding of NFκB to the IL-8 and COX-2 proximal promoters using real-time PCR with primers positioned at NFκB response elements (black bars). Primers positioned at the β-globin promoter (white bars) were used as “no binding” control. Results are shown as percent recovery relative to input. H: Cultures of newly differentiated human adipocytes were serum-starved for 24 h and then treated for 12 h with BSA vehicle (V) or 50 μM 10,12 CLA (10), or 50 μM 10,12 CLA + 100 μM TMB-8 (10+T) and then harvested for real-time PCR analysis of CaMKII mRNA levels. One-way ANOVA was used to compare data. Means (± SEM; n = 5) that do not share a common lower case letter differ (P < 0.05). Data in all panels are representative of at least two independent experiments.
Fig. 3.
Fig. 3.
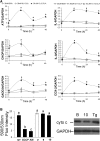
Time course of CLA–mediated increase in stress-related and inflammatory gene expression. A: Cultures of newly differentiated human adipocytes were serum-starved for 24 h and then treated for 6, 12, 24, or 48 h with BSA vehicle (circle open), 30 μM cis-9, trans-11 CLA (square open), or 30 μM trans-10, cis-12 CLA (triangle up filled), and then harvested. RNA was isolated and the mRNA levels of ATF3, CHOP, GADD34, IL-6, IL-8, COX-2, and GAPDH (load control) were measured using real-time PCR. Means (± SEM; n = 2) with asterisks (*) differ significantly (P < 0.05) from the BSA controls at each time point, and are representative of at least two independent experiments. Statistical analyses were performed for data testing the main effects of treatment (BSA, 10,12 CLA, 9,11 CLA) and time (6, 12, 24, 48 h) and their interaction. B: To measure indicators of mitochondrial stress (i.e., less JC-1 staining and more cytoplasmic cytochrome C), cultures of human adipocytes were treated vehicle control (NT), the positive controls CCCP (20 μM), antimycin A (AM, 20 nM), or thapsigargin (Tg), or BSA vehicle (V), 50 μM 9,11 CLA (9), or 50 μM 10,12 CLA (10) for 12 h (JC-1 staining) or 24 h (cytochrome C [cyto C] release). For the JC-1 assay, fluorescence was measured at 590 and 530 nm. Means (± SE; n = 6–12) that do not share a common lowercase letter differ (P < 0.05). Data are representative of two independent experiments. One-way ANOVA was used to compare data. For the cytochrome C release assay, cells were harvested and subcellular fractionation was performed to collect mitochondrial and cytosolic proteins. The cytosolic fraction was immunoblotted for cytochrome C and GAPDH. Data are representative of one independent experiment.
Fig. 4.
Fig. 4.
10,12 CLA-induced inflammatory and ISR gene expression are dependent on [Ca+2]i. A: Cultures of newly differentiated human adipocytes were treated for 12 h with thapsigargin (Tg) in the absence or presence of 100 μM TMB-8 (T). B: Cultures were treated for 12 h with BSA vehicle (V), 50 μM 10,12 CLA alone (10), or 10,12 CLA in the presence of 2 μM BAPTA (10+B), 10 μM KN-62 (10+K), or 100 μM TMB-8 (10+T). A and B: RNA was subsequently isolated and the mRNA levels of IL-8, IL-6, COX-2, ATF-3, CHOP, GADD34, or GAPDH were measured by real-time PCR. Data are normalized to the vehicle controls. Means (± SEM; n = 2) that do not share a common lower case letter differ (P < 0.05). Data are representative of three independent experiments. One-way ANOVA was used to compare data.
Fig. 5.
Fig. 5.
10,12 CLA increase of [Ca2+]i, ROS levels and expression of inflammatory and ISR genes are dependent on PLC. A: Cultures of newly differentiated human adipocytes were preloaded with 5 μM Fluo-3 AM. Cultures were injected with vehicle (−), 50 μM 10,12 CLA (circle filled), or 25 μM D609 pretreatment + 50 μM 10,12 CLA (circle open). Emitted fluorescence intensities were collected over time using a multidetection microplate reader. Excitation wavelength was 485 nm, and fluorescence was collected at 528 nm. Means (± SEM; n = 4) are representative of two independent experiments. B: Cultures of newly differentiated human adipocytes were preloaded with DCF for 30 min. Cultures were then treated with BSA vehicle (V) or 50 μM 10,12 CLA (10) alone for 12 h, or pretreated for 30 min with 50 μM D609 followed by 12-h treatment with BSA vehicle (D) or 50 μM 10,12 CLA (10+D). Emitted fluorescence intensities were measured using a multidetection microplate reader. Excitation wavelength was 485 nm, and fluorescence was collected at 528 nm. Means (± SEM; n = 3–12) are representative of three independent experiments. C: Cultures were pretreated for 30 min with 50 μM D609 (D) followed by 12-h treatment with BSA vehicle (V) or 50 μM 10,12 CLA (10). RNA was subsequently isolated and mRNA levels of IL-8, COX-2, ATF-3, GADD34, and GAPDH were measured by real-time PCR. Data are normalized to the vehicle controls. Means (± SEM; n = 2) that do not share a common lower case letter differ (P < 0.05). Data are representative of three independent experiments. One-way ANOVA was used to compare data.
Fig. 6.
Fig. 6.
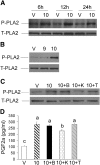
10,12 CLA activation of the inflammatory PG pathway is not dependent on [Ca2+]i. A: Cultures of newly differentiated human adipocytes were treated with BSA vehicle (V) or 30 μM 10,12 CLA (10) for 6, 12, or 24 h. Cells were harvested and immunoblotted for p-PLA2 and total PLA2. B: Cultures were treated for 12 h with BSA vehicle (V), 30 μM 9,11 CLA (9), or 30 μM 10,12 CLA (10), and immunoblotted as in A. Data are representative of three experiments. C: Cultures were treated for 12 h with BSA vehicle (V), 50 μM 10,12 CLA alone (10), or 10,12 CLA in presence of 2 μM BAPTA (10+B), 10 μM KN-62 (10+K), or 100 μM TMB-8 (10+T), and immunoblotted as in A. D: Cultures were treated for 24 h with BSA vehicle (V), 50 μM 10,12 CLA alone (10), or 10,12 CLA in the presence of 2 μM BAPTA (10+B), 10 μM KN-62 (10+K), or 100 μM TMB-8 (10+T). Conditioned media were subsequently collected and PGF levels were measured using a commercially available EIA kit. Means (± SEM; n = 2) not sharing a common lower case letter differ (P < 0.05). Data in all panels are representative of three independent experiments. One-way ANOVA was used to compare data.
Fig. 7.
Fig. 7.
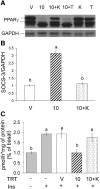
10,12 CLA–mediated insulin resistance is attenuated by KN-62. A: Cultures of newly differentiated human adipocytes were treated for 48 h with BSA vehicle (V); 50 μM 10,12 CLA (10); 10,12 CLA + 10 μM KN-62 (10+K); 10,12 CLA + 100 μM TMB (10+T); 10 μM KN-62 (K); or 100 μM TMB-8 (T). Cultures were harvested and immunoblotted for PPARγ and GAPDH. B: Cultures were treated for 48 h with BSA vehicle (V); 50 μM 10,12 CLA alone (10); or 10,12 CLA in the presence of 10 μM KN-62 (10+K). Cells were harvested for RNA, and SOCS-3 and GAPDH were measured by real-time PCR. C: Cultures were treated for 48 h with BSA vehicle (V); 50 μM 10,12 CLA alone (10); or 10,12 CLA in the presence of 10 μM KN-62 (10+K). Uptake of basal or insulin-stimulated [3H]2- deoxy-glucose was subsequently measured in cultures treated without (−) or with (+) insulin. Means (± SEM; n = 3) that do not share a common lower case letter differ (P < 0.05). Data in all panels are representative of three independent experiments. One-way ANOVA was used to compare data.
Fig. 8.
Fig. 8.
Working model: 10,12 CLA–mediated oxidative stress, inflammation, and insulin resistance are regulated, in part, by [Ca2+]i. Acutely, 10,12 CLA increases [Ca2+]i levels, which are dependent on PLC activity and mobilization of calcium from the ER initially, which is sustained by an influx of calcium from extracellular sources. This increase activates ROS and CaMKII, which in turn activate MAPK and NFκB that trigger ISR and inflammatory gene expression. The second and more chronic response to 10,12 CLA begins with PLA2 activation and PGF production, which appears to be independent of calcium. This causes another phase of calcium signaling that further activates CaMKII, leading to the suppression of PPARγ and the development of insulin resistance.

Similar articles

Cited by

References

    1. Centers for Disease Control and Prevention. US Obesity Trends, 1985–2006. Accessed 2007 at http://www.cdc.gov/nccdphp/dnpa/obesity/trend/maps/index.htm.
    1. Kennedy A., Martinez K., Schmidt S., Mandrup S., Lapoint K., McIntosh M. 2009. Anti-obesity mechanisms of action of conjugated linoleic acid. J. Nutr. Biochem. 21: 171–179. - PMC - PubMed
    1. Whigham L. D., Watras A. C., Schoeller D. A. 2007. Efficacy of conjugated linoleic acid for reducing fat mass: a meta-analysis in humans. Am. J. Clin. Nutr. 85: 1203–1211. - PubMed
    1. Granlund L., Juvet L. K., Pedersen J. I., Nebb H. I. 2003. Trans10, cis12-conjugated linoleic acid prevents triacylglycerol accumulation in adipocytes by acting as a PPARgamma modulator. J. Lipid Res. 44: 1441–1452. - PubMed
    1. Brown J. M., Boysen M. S., Chung S., Fabiyi O., Morrison R. F., Mandrup S., McIntosh M. K. 2004. Conjugated linoleic acid induces human adipocyte delipidation: autocrine/paracrine regulation of MEK/ERK signaling by adipocytokines. J. Biol. Chem. 279: 26735–26747. - PMC - PubMed

Publication types

MeSH terms

Substances