

Differential roles of CIDEA and CIDEC in insulin-induced anti-apoptosis and lipid droplet formation in human adipocytes
- PMID: 20154362
- PMCID: PMC2882716
- DOI: 10.1194/jlr.M002147
Differential roles of CIDEA and CIDEC in insulin-induced anti-apoptosis and lipid droplet formation in human adipocytes
Abstract
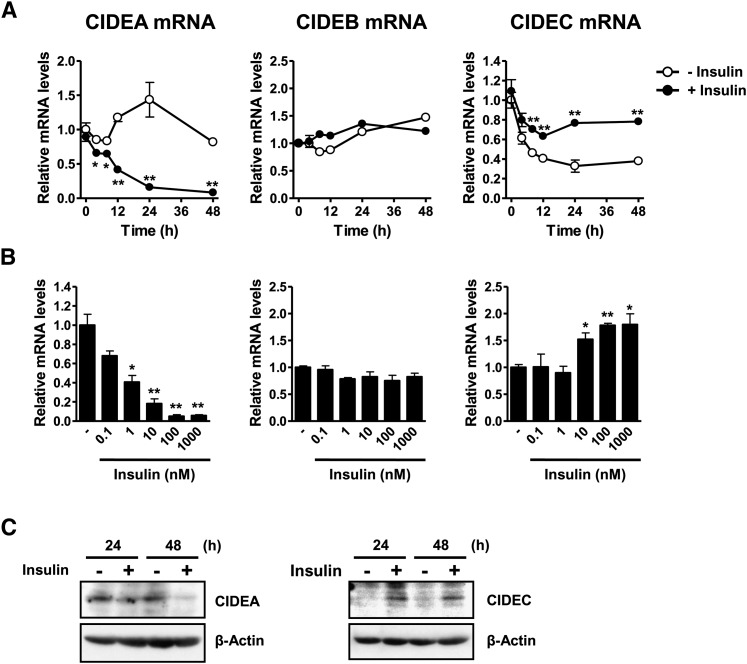
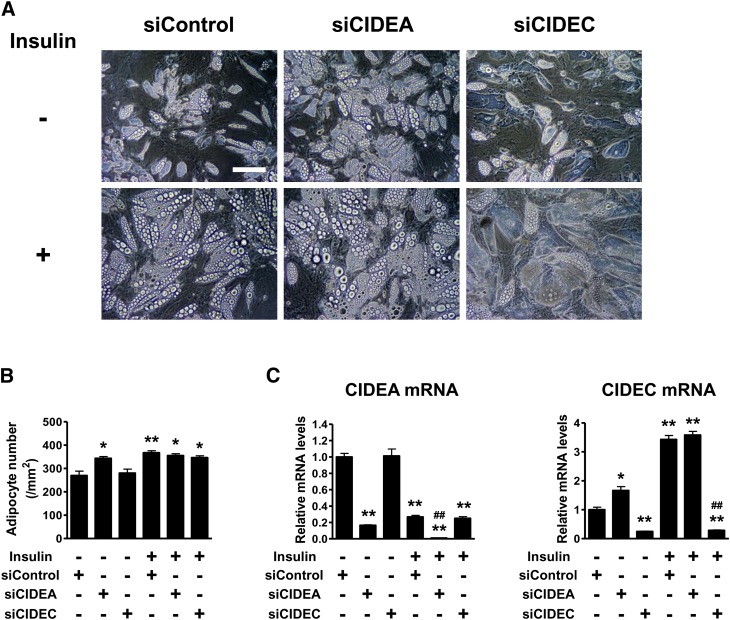
Both insulin and the cell death-inducing DNA fragmentation factor-alpha-like effector (CIDE) family play important roles in apoptosis and lipid droplet formation. However, regulation of the CIDE family by insulin and the contribution of the CIDE family to insulin actions remain unclear. Here, we investigated whether insulin regulates expression of the CIDE family and which subtypes contribute to insulin-induced anti-apoptosis and lipid droplet formation in human adipocytes. Insulin decreased CIDEA and increased CIDEC but not CIDEB mRNA expression. Starvation-induced apoptosis in adipocytes was significantly inhibited when insulin decreased the CIDEA mRNA level. Small interfering RNA-mediated depletion of CIDEA inhibited starvation-induced apoptosis similarly to insulin and restored insulin deprivation-reduced adipocyte number, whereas CIDEC depletion did not. Lipid droplet size of adipocytes was increased when insulin increased the CIDEC mRNA level. In contrast, insulin-induced enlargement of lipid droplets was markedly abrogated by depletion of CIDEC but not CIDEA. Furthermore, depletion of CIDEC, but not CIDEA, significantly increased glycerol release from adipocytes. These results suggest that CIDEA and CIDEC are novel genes regulated by insulin in human adipocytes and may play key roles in the effects of insulin, such as anti-apoptosis and lipid droplet formation.
Figures


Similar articles
-
Differential regulation of CIDEA and CIDEC expression by insulin via Akt1/2- and JNK2-dependent pathways in human adipocytes.J Lipid Res. 2011 Aug;52(8):1450-60. doi: 10.1194/jlr.M012427. Epub 2011 Jun 2. J Lipid Res. 2011. PMID: 21636835 Free PMC article.
-
Differential Roles of Cell Death-inducing DNA Fragmentation Factor-α-like Effector (CIDE) Proteins in Promoting Lipid Droplet Fusion and Growth in Subpopulations of Hepatocytes.J Biol Chem. 2016 Feb 26;291(9):4282-93. doi: 10.1074/jbc.M115.701094. Epub 2016 Jan 5. J Biol Chem. 2016. PMID: 26733203 Free PMC article.
-
Cell death-inducing DFF45-like effector, a lipid droplet-associated protein, might be involved in the differentiation of human adipocytes.FEBS J. 2010 Oct;277(20):4173-83. doi: 10.1111/j.1742-4658.2010.07806.x. FEBS J. 2010. PMID: 20945533
-
CIDE proteins and metabolic disorders.Curr Opin Lipidol. 2009 Apr;20(2):121-6. doi: 10.1097/MOL.0b013e328328d0bb. Curr Opin Lipidol. 2009. PMID: 19276890 Review.
-
CIDE Proteins in Human Health and Disease.Cells. 2019 Mar 13;8(3):238. doi: 10.3390/cells8030238. Cells. 2019. PMID: 30871156 Free PMC article. Review.
Cited by
-
Cell death-inducing DFFA-like effector c (CIDEC/Fsp27) gene: molecular cloning, sequence characterization, tissue distribution and polymorphisms in Chinese cattles.Mol Biol Rep. 2013 Dec;40(12):6765-74. doi: 10.1007/s11033-013-2793-y. Epub 2013 Sep 25. Mol Biol Rep. 2013. PMID: 24065549
-
The omentum of obese girls harbors small adipocytes and browning transcripts.JCI Insight. 2020 Mar 26;5(6):e135448. doi: 10.1172/jci.insight.135448. JCI Insight. 2020. PMID: 32125283 Free PMC article.
-
Differential regulation of CIDEA and CIDEC expression by insulin via Akt1/2- and JNK2-dependent pathways in human adipocytes.J Lipid Res. 2011 Aug;52(8):1450-60. doi: 10.1194/jlr.M012427. Epub 2011 Jun 2. J Lipid Res. 2011. PMID: 21636835 Free PMC article.
-
The genetic contribution of CIDEA polymorphisms, haplotypes and loci interaction to obesity in a Han Chinese population.Mol Biol Rep. 2013 Oct;40(10):5691-9. doi: 10.1007/s11033-013-2671-7. Epub 2013 Sep 21. Mol Biol Rep. 2013. PMID: 24057179
-
Comparative Proteome Analysis Reveals Lipid Metabolism-Related Protein Networks in Response to Rump Fat Mobilization.Int J Mol Sci. 2018 Aug 28;19(9):2556. doi: 10.3390/ijms19092556. Int J Mol Sci. 2018. PMID: 30154394 Free PMC article.
References
-
- Gesta S., Tseng Y. H., Kahn C. R. 2007. Developmental origin of fat: tracking obesity to its source. Cell. 131: 242–256. - PubMed
-
- Haslam D. W., James W. P. 2005. Obesity. Lancet. 366: 1197–1209. - PubMed
-
- Hirsch J., Batchelor B. 1976. Adipose tissue cellularity in human obesity. Clin. Endocrinol. Metab. 5: 299–311. - PubMed
-
- Sakai T., Sakaue H., Nakamura T., Okada M., Matsuki Y., Watanabe E., Hiramatsu R., Nakayama K., Nakayama K. I., Kasuga M. 2007. Skp2 controls adipocyte proliferation during the development of obesity. J. Biol. Chem. 282: 2038–2046. - PubMed
MeSH terms
Substances
LinkOut - more resources
Full Text Sources
Medical
