Review
. 2010;86(2):103-16.
doi: 10.2183/pjab.86.103.

Recent advances in rice genome and chromosome structure research by fluorescence in situ hybridization (FISH)

Affiliations
Review

Recent advances in rice genome and chromosome structure research by fluorescence in situ hybridization (FISH)

Nobuko Ohmido et al. Proc Jpn Acad Ser B Phys Biol Sci. 2010.

Abstract

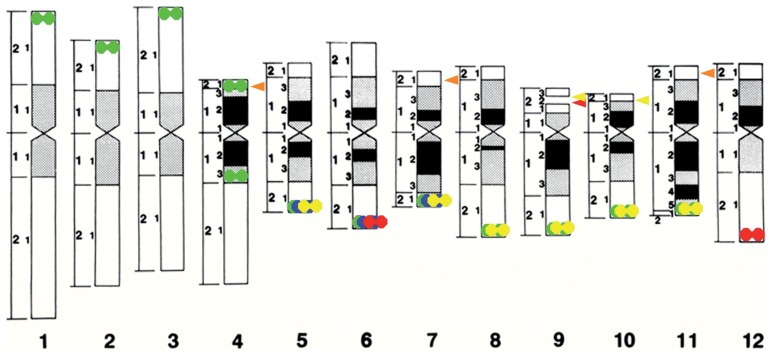
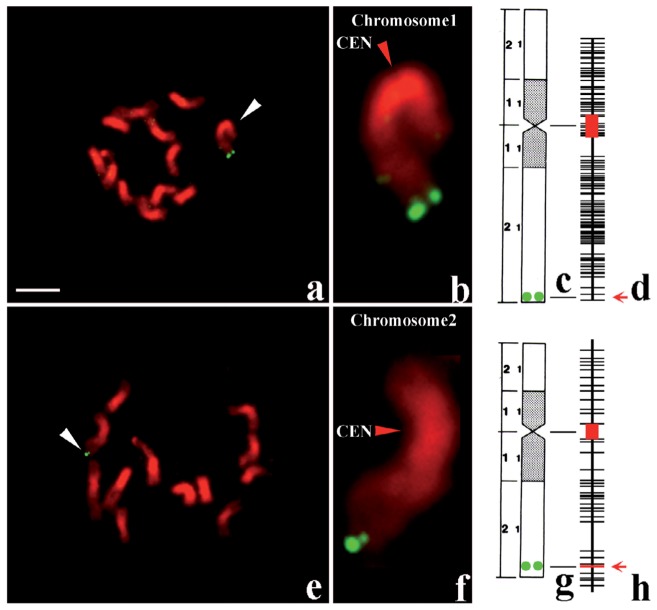
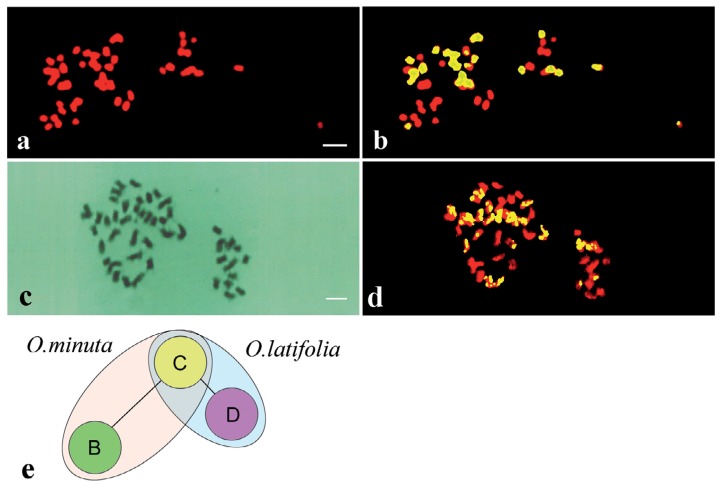
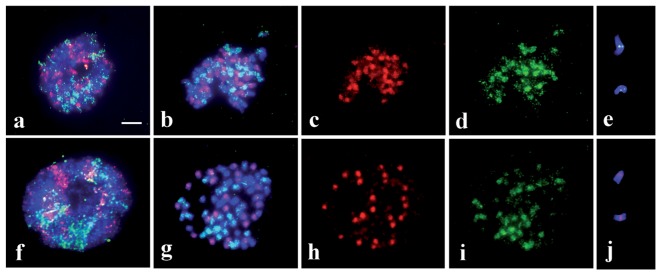
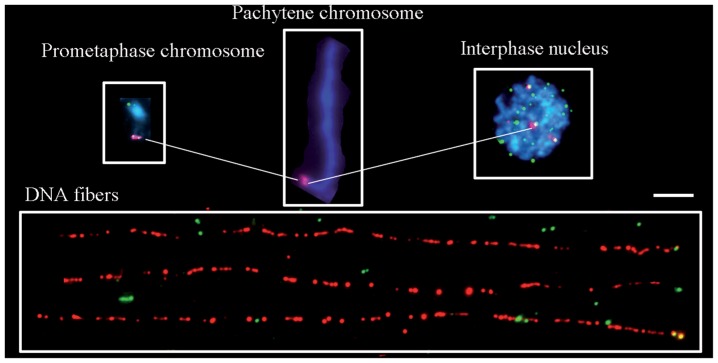
Fluorescence in situ hybridization (FISH) is an effective method for the physical mapping of genes and repetitive DNA sequences on chromosomes. Physical mapping of unique nucleotide sequences on specific rice chromosome regions was performed using a combination of chromosome identification and highly sensitive FISH. Increases in the detection sensitivity of smaller DNA sequences and improvements in spatial resolution have ushered in a new phase in FISH technology. Thus, it is now possible to perform in situ hybridization on somatic chromosomes, pachytene chromosomes, and even on extended DNA fibers (EDFs). Pachytene-FISH allows the integration of genetic linkage maps and quantitative chromosome maps. Visualization methods using FISH can reveal the spatial organization of the centromere, heterochromatin/euchromatin, and the terminal structures of rice chromosomes. Furthermore, EDF-FISH and the DNA combing technique can resolve a spatial distance of 1 kb between adjacent DNA sequences, and the detection of even a 300-bp target is now feasible. The copy numbers of various repetitive sequences and the sizes of various DNA molecules were quantitatively measured using the molecular combing technique. This review describes the significance of these advances in molecular cytology in rice and discusses future applications in plant studies using visualization techniques.


Figures

Fig. 1
Fig. 1
Distribution patterns of the genome-specific repetitive sequence TrsA and rDNA sites on a rice chromosome idiogram. Black and gray boxes: heavily and moderately condensed regions, respectively, based on the condensation patterns determined by CHIAS3. Doublet circles: Trs sites—two in O. sativa ssp. japonica (red), six in O. sativa ssp. indica (yellow), three in O. glaberrima (blue) and 12 in O. meridionalis (green). Most of those sites are located on the distal ends of long arms. Arrowhead: rDNA site—one in O. sativa ssp. japonica (red), two in O. sativa ssp. indica (yellow) and three each in O. officinalis and O. eichingeri (orange).
Fig. 2
Fig. 2
Physical mapping by FISH of a YAC clone (400 kb) carrying the gall midge resistance gene, Gm2, and a BAC clone (180 kb) containing a rice blast resistance gene, Pi-b, on rice haploid chromosomes. a–d: Mapping of the Gm2 carrying YAC clone that appeared as green fluorescent doublets on the probed chromosome 1. e–h: Mapping of the Pi-b carrying BAC clone that appeared as the green fluorescent doublets on the probed chromosome 2. a and e: An entire somatic haploid metaphase plate with 12 chromosomes, of which probed chromosome is indicated by a white arrowhead. b and f: Enlarged image of the respective signal-tagged chromosome, of which centromere is shown by red arrowhead. c and g: Cytological maps of chromosome 1 and 2, carrying Gm2 and Pi-b gene, respectively. Green doublet circles show the site of the probed YAC or BAC clone. d and h: Genetic maps of chromosome 1 and 2, of which centromeric regions are indicated by red boxes, and the sites of probed YAC and BAC clones by red arrows.
Fig. 3
Fig. 3
Genomic in situ hybridization (GISH) of two amphidiploids, O. minuta (BBCC, 2n = 48) and O. latifolia (CCDD, 2n = 48). a and b: Chromosomes of O. minuta. (a) Counterstained with propidium iodide, and (b) composite chromosome images of the counterstaining (red) and C genome signal image (yellow). c and d: GISH of O. latifolia (CCDD, 2n = 48) chromosomes. (c) Giemsa stained chromosomes before GISH and (d) a composite chromosome image of counterstaining (red) and signal image (yellow). e: Schematic representation of the genetic relationships between the B, C, and D genomes. Distances between the genomes are in arbitrary units. Bar indicates 10 μm.
Fig. 4
Fig. 4
Multicolor genomic in situ hybridization (McGISH) of somatic hybrids having the A, B, and C genomes with the different combinations of the genomic probes. Upper panel: McFISH results with two probes of A (red) and B (green) genomes with the counterstained C genome (blue) with 4’,6-diamidino-2-phenylindole (DAPI). Lower panel: McFISH results with two probes of A (red) and C (green) genomes with the counterstaining B genome with DAPI (blue). a and f: McGISH of the whole nucleus, in which A genome is colored in red, B genome in green or blue, and C genome in blue or green. b and g: Identification of the chromosomes of three genomes by their fluorescent color, those of the A, B and C genome chromosomes being identified with red, green or blue, and blue or green fluorescence, respectively. c and h: Identification of the A genome chromosomes with red fluorescence. d and i: Identification of the B and C genome chromosomes with green fluorescence. e and j: Insertion of the B genome chromosome fragments to the C genome chromosomes and that of the A genome chromosome fragments to the B genome chromosomes, respectively. Bar indicates 5 μm.
Fig. 5
Fig. 5
High resolution FISH of rice somatic chromosomes, pachytene chromosomes, the nucleus, and extended DNA fibers. Upper left: DAPI- stained mitotic prometaphase chromosome 12 with telomere signals (green) and the subtelomeric tandem repeat TrsA (red). Upper middle: A pachytene bivalent of the same chromosomes with TrsA (red), in which heterochromatin and euchromatin are well differentiated. Upper right: Interphase nucleus, in which telomere sequences, TTTAGGGs and TrsA are colored in green and red, respectively. Bottom: Extended DNA fibers (EDFs) measuring 74 μm with 242 kb TrsA’s (red) and telomere sequence (green). EDFs resemble “beads-on-a-string”. All figures are at the same magnification. Bar indicates 5 μm.

Similar articles

Cited by

References

    1. Gill B.S., Friebe B. (1998) Plant cytogenetics at the dawn of the 21st century. Curr. Opin. Plant Biol. 1, 109–115 - PubMed
    1. Mukai Y. (1996) In situ hybridization. InPlant Chromosomes Laboratory Methods (eds. Fukui K., Nakayama S.). CRC Press, New York, pp. 155–170
    1. Mukai Y. (2005) Perspectives in molecular cytogenetics of wheat. Frontiers of Wheat Bioscience. Memorial Issue, Wheat Inf. Serv. 100, 17–31
    1. de Jong H. (2003) Visualizing DNA domains and sequences by microscopy: a fifty-year history of molecular cytogenetics. Genome 46, 943–946 - PubMed
    1. Lysak M.A., Pecinka A., Schubert I. (2003) Recent progress in chromosome painting of Arabidopsis and related species. Chromosome Res. 11, 195–204 - PubMed

MeSH terms