. 2010 Mar;17(3):280-8.
doi: 10.1038/nsmb.1758. Epub 2010 Feb 14.

Munc13 C2B domain is an activity-dependent Ca2+ regulator of synaptic exocytosis

Affiliations

Munc13 C2B domain is an activity-dependent Ca2+ regulator of synaptic exocytosis

Ok-Ho Shin et al. Nat Struct Mol Biol. 2010 Mar.

Abstract

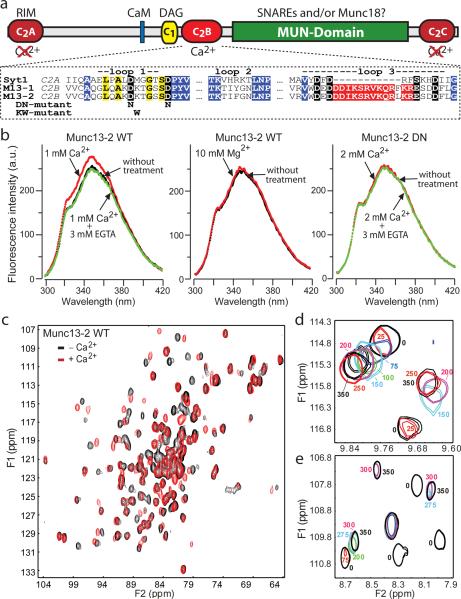
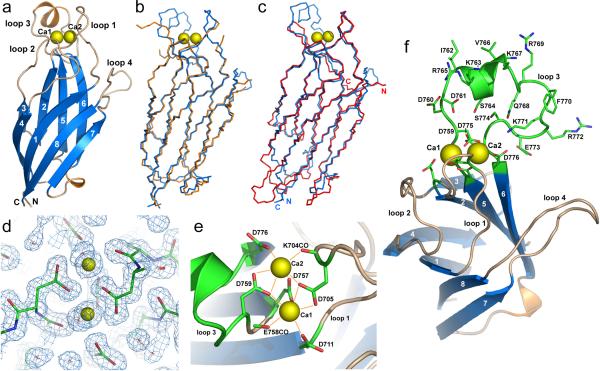
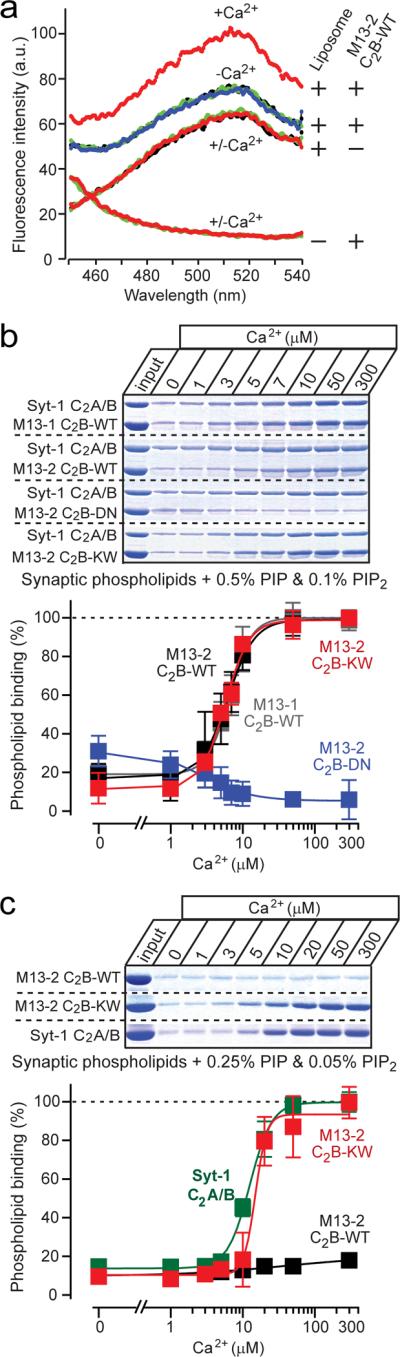
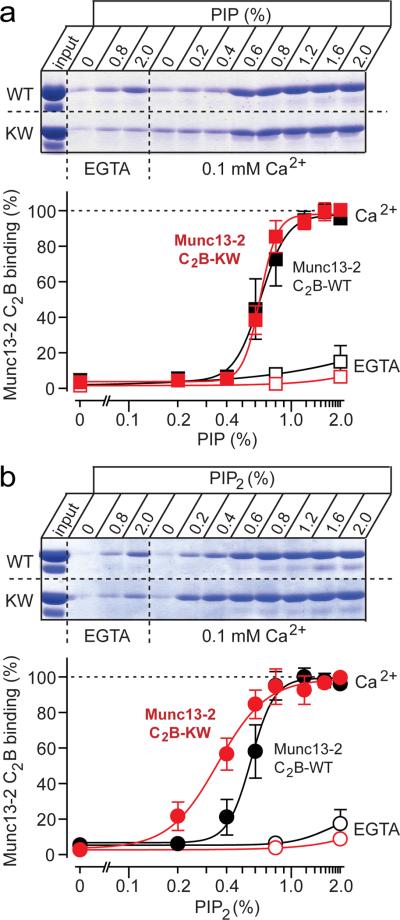
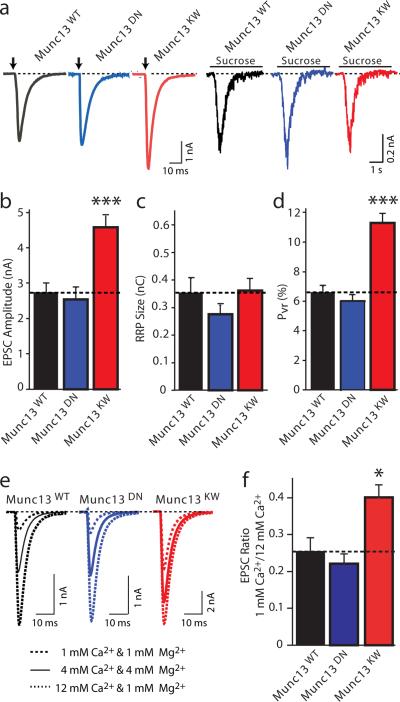
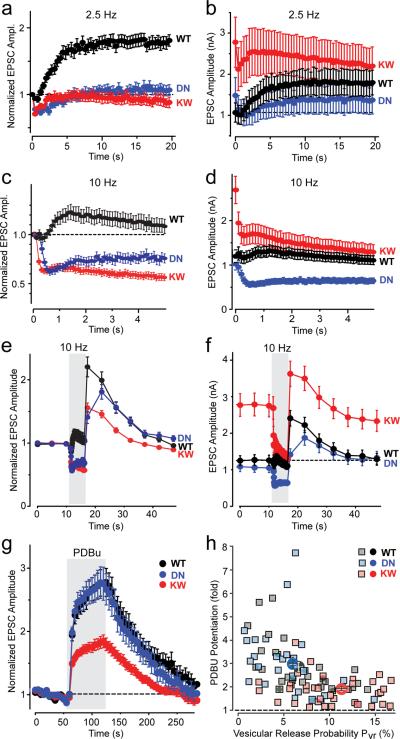
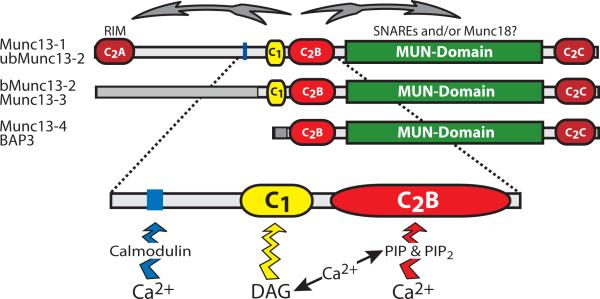
Munc13 is a multidomain protein present in presynaptic active zones that mediates the priming and plasticity of synaptic vesicle exocytosis, but the mechanisms involved remain unclear. Here we use biophysical, biochemical and electrophysiological approaches to show that the central C(2)B domain of Munc13 functions as a Ca(2+) regulator of short-term synaptic plasticity. The crystal structure of the C(2)B domain revealed an unusual Ca(2+)-binding site with an amphipathic alpha-helix. This configuration confers onto the C(2)B domain unique Ca(2+)-dependent phospholipid-binding properties that favor phosphatidylinositolphosphates. A mutation that inactivated Ca(2+)-dependent phospholipid binding to the C(2)B domain did not alter neurotransmitter release evoked by isolated action potentials, but it did depress release evoked by action-potential trains. In contrast, a mutation that increased Ca(2+)-dependent phosphatidylinositolbisphosphate binding to the C(2)B domain enhanced release evoked by isolated action potentials and by action-potential trains. Our data suggest that, during repeated action potentials, Ca(2+) and phosphatidylinositolphosphate binding to the Munc13 C(2)B domain potentiate synaptic vesicle exocytosis, thereby offsetting synaptic depression induced by vesicle depletion.


Figures

Figure 1
Figure 1. The Munc13-1 C2B-domain is a Ca2+-binding module
a. Domain organization of Munc13-1 and bMunc13-2. The binding activities of various domains are indicated above (CaM = calmodulin; DAG = diacylglycerol), and their presumed Ca2+-binding ability below the domains. An alignment of the Ca2+-binding loops from the synaptotagmin-1 C2A-domain, the Munc13-1 C2B-domain, and the Munc13-2 C2B-domain is shown below the domain organization (residues 162–241 from rat synaptotagmin-1 [acc. # X52772]; 695–779 from rat Munc13-1 [acc. # U24070]; and 619–703 from rat bMunc13-2 [acc. # AF159706]). In the alignment, conserved sequences are highlighted (black = Ca2+-binding residues; yellow = top loop; blue = β-strands; red = conserved charged sequence in loop 3 specific for the Munc13 C2B-domains). The two C2B-domain mutations analyzed (“DN” and “KW”) are described at the bottom. b. Fluorescent emission spectra of WT and DN-mutant Munc13-2 C2B-domains without and with 1 mM Ca2+ plus/minus EGTA, or with 10 mM Mg2+ (for data on Munc13-1 and for individual spectra, see Supplementary Fig. 1). c. 1H-15N HSQC spectra of the Munc13-1 C2B-domain in the absence (black contours) and presence (red contours) of 0.5 mM Ca2+. d, e. Ca2+-binding to the Munc13-1 C2B-domain monitored with 1H-15N HSQC spectra. The diagrams show expansions of superpositions of selected 1H-15N HSQC spectra acquired during a titration of Ca2+ from 0 to 0.7 mM. The contours are color coded according to the Ca2+-concentration (indicated in μM next to the contours).
Figure 2
Figure 2. Three-dimensional structures of the Ca2+-free and Ca2+-bound Munc13-1 C2B-domain
a. Ribbon diagram of the crystal structure of the Ca2+-bound Munc13-1 C2B-domain (blue = β-strands; orange = α-helices). Bound Ca2+-ions are shown as yellow spheres; β-strands are numbered from 1 to 8. The top loops are labeled loop 1 – loop 4; N and C indicate N- and C-termini, respectively. See Supplementary Fig. 2 for analysis of crystal contacts. b. Backbone superposition of the Ca2+-free (orange) and Ca2+-bound (blue) Munc13-1 C2B-domains. c. Backbone superposition of the crystal structures of the Ca2+-bound Munc13-1 C2B-domain (blue) and the Ca2+-free synaptotagmin-1 C2A-domain (red; PDB accession code 1rsy). N- and C-termini of both domains are indicated with letters of the corresponding color. d. 2Fo−Fc electron density map contoured at 1σ of the Ca2+-binding region of the Munc13-1 C2B-domain superimposed with a stick model of the protein. Ca2+-ions and water molecules are represented by yellow spheres and red stars, respectively. In this and the following panels, protein atoms are color coded: green, carbon; blue, nitrogen; red, oxygen. e. Ribbon-and-stick diagram summarizing the Ca2+-binding mode of the Munc13-1 C2B-domain. The water molecules are not shown for simplicity. All other Ca2+-ligands are shown as stick models and labeled; K704CO and E758CO denote the backbone carbonyl group of the corresponding residues. Ca2+-ions are labeled Ca1 and Ca2. f. Ribbon-and-stick diagram of the Munc13-1 C2B-domain illustrating the amphipathic character of the α-helix of loop 3. The side chains of the Ca2+ ligands and of all residues in loop 3 are shown as stick models.
Figure 3
Figure 3. Ca2+-dependent binding of the Munc13 C2B-domain to PIP/PIP2-containing liposomes
a. FRET assays of Ca2+-dependent binding of the Munc13 C2B-domain to dansyl-labeled `synaptic' liposomes containing 0.5% PIP and 0.1% PIP2 (0.03 mg/ml; total volume = 0.6 ml). Fluorescence spectra (excitation = 282 nm) were monitored in solutions containing either only the C2B-domain, liposomes, or both as indicated on the right. Spectra were first recorded in Ca2+-free buffer (black traces, covered by overlying green, red, or blue traces), then after addition of 2 mM Mg2+ (blue traces, under the overlying green or red traces), then after addition of 0.2 mM Ca2+ (red traces), then again after further addition of 1 mM EGTA (green trace, done only for the samples containing both liposomes and C2B-domain protein). Data show a representative experiment repeated multiple times; see Supplementary Fig. 3 for individual spectra. b, c. Centrifugation assays of Ca2+-dependent Munc13 C2B-domain binding to `synaptic' liposomes containing 0.5% PIP and 0.1% PIP2 (b), or 0.25% PIP and 0.05% PIP2 (c). GST-fused Munc13 C2B-domains and the synaptotagmin-1 C2A/B-domain fragment (used as an internal control) were bound to liposomes at the indicated free Ca2+-concentrations clamped with Ca2+/EGTA buffer containing 2 mM Mg2. Co-pelleted Munc13 and synaptotagmin-1 C2-domains were analyzed by SDS-PAGE and Coomassie Blue staining, and quantified by scanning (top panels = representative experiments; bottom panels = summary graphs (means ± SEMs [n=3]); data were normalized to binding at the highest Ca2+-concentration; quantitations for synaptotagmin-1 for panel b are shown in Supplementary Fig. 4).
Figure 4
Figure 4. PIP- and PIP2-dependence of Ca2+-induced liposome binding to Munc13 C2B-domains
a, b Quantitation of Ca2+-dependent Munc13 C2B-domain binding to `synaptic' liposomes as a function of the PIP- (a) or PIP2-concentration (b). Binding assays were carried out using the centrifugation assay (Figs. 3b and 3c) in the absence (open symbols) or presence of 0.1 mM Ca2+ (filled symbols) as a function of the concentration of PIP (a) or PIP2 (b) in the liposomes. The top panels display representative experiments, and the bottom panels summary graphs (means ± SEMs [n=3]; data were normalized to binding at the highest free Ca2+ concentration). Wild-type and KW-mutant C2B-domains are not significantly different for the PIP titration (a), but are significantly different for the PIP2 titration (b; p=0.0016 using a 2-way ANOVA test; see Supplementary Fig. 5 for direct comparison of the binding of the WT C2B-domain to PIP- or PIP2-containing liposomes).
Figure 5
Figure 5. Effect of Munc13-2 C2B-domain mutations on release induced by isolated action potentials
All experiments in this figure and Fig. 6 were performed in hippocampal autaptic neurons cultured from Munc13-1/-2 double KO mice. Neurons were infected with recombinant Semliki Forest Virus expressing WT, DN-mutant, or KW-mutant Munc13-2, and excitatory postsynaptic currents (EPSCs) were recorded in whole-cell mode. a, Representative EPSCs evoked by isolated action potentials (left) or 0.5 M sucrose (right) in neurons expressing WT (black), DN-mutant (blue), or KW-mutant Munc13-2 (red). bd, Mean EPSC amplitudes (b), RRP size (c, measured as the response to 0.5 M sucrose, integrating the transient current component for 4 s); and vesicular release probability (d, calculated as the ratio of the charge of evoked responses to that of the RRP). Data shown are means ± SEMs (n= (WT: n=58; DN: n=57; KW: n=79; ***, p<0.001 by paired t-test). e, Representative EPSCs evoked by isolated action potentials in neurons expressing WT (black), DN-mutant (blue), or KW-mutant Munc13-2 (red) at three different Ca2+-concentrations as indicated. f, Mean ratio of the EPSC amplitudes monitored at low vs. high Ca2+ in neurons expressing WT (black), DN-mutant (blue), or KW-mutant Munc13-2 (red; WT, n=16; DN, n=14; KW, n=16; *, p<0.05; see Supplementary Table 2 for a numerical listing of all electrophysiologically results.
Figure 6
Figure 6. Ca2+-binding to the Munc13 C2B-domain regulates release during high-frequency action potential trains
a, b. Mean normalized (left panels) and absolute (right panels) EPSC amplitudes in response to a 2.5 Hz (a) or 10 Hz (b) action potential train in Munc13-deficient neurons expressing WT (black), DN-mutant (blue), or KW-mutant Munc13-2 (red; means ± SEMs). In the normalized plots (left panels), p<0.001 for WT compared to DN- and KW-mutant Munc13-2; in the absolute responses (right panels), the initial responses are significantly larger (p<0.01) for the KW-mutant Munc13-2 compared to the WT or DN-mutant protein, whereas the final responses are significantly smaller (p<0.001) for the DN-mutant compared to the WT and KW-mutant Munc13-2 (2.5 Hz, WT n=18; KW n=21; DN; n=16; 10 Hz, WT n=50; DN n=41; KW n=64). c., d. Normalized (c) and absolute EPSC amplitudes (d) in response to a low-frequency stimulus train (0.2 Hz) that is interrupted by a 5 sec 10 Hz stimulus train to induce augmentation (gray area). Munc13-deficient neurons expressing WT (black), DN-mutant (blue), or KW-mutant Munc13-2 (red) were analyzed (for normalized responses, degree of augmentation is significantly higher (p<0.001) for WT compared to DN- and KW-mutant Munc13-2; for absolute responses, all three Munc13 forms differ significantly from each other at the p<0.001 level (WT n=50; DN n=41; KW n=64)). e. Relative potentiation by PDBu (1 μM) of EPSC amplitudes evoked at 0.2 Hz in Munc13-deficient neurons expressing WT (black), DN-mutant (blue), or KW-mutant Munc13-2 (red). The relative PDBu potentiation was significantly lower (p<0.001) in synapses expressing KW-mutant Munc13-2 than in synapses expressing WT or DN-mutant Munc13-2 (WT, n=30; DN, n=31; KW, n=43). f. Plot of the degree of PDBu potentiation as a function of the initial vesicular release probability (Pvr) in individual neurons. Each individual data point represents a Munc13-deficient neuron expressing WT (black), DN-mutant (blue), or KW-mutant Munc13-2 (red). The solid symbols represent the mean values for each group.
Figure 7
Figure 7. Model for the Ca2+-regulation of short-term plasticity by Munc13
The top diagrams depict the domain structures of the three sub-families of Munc13 proteins, the two classes of long Munc13s expressed primarily in brain, and the class of short Munc13s expressed primarily in peripheral organs. Top arrows illustrate a possible regulation of the N-terminal RIM-binding sequences and the C-terminal MUN-domain of Munc13s by ligand-binding to the central C1- and C2-domains. The central regulatory domains of Munc13's are illustrated below the domain diagrams: the calmodulin-binding sequence found in Munc13-1 and bMunc13-2, the DAG-binding C1-domain found in all variants of Munc13-1, -2, and -3 but not the ubiquitous Munc13 isoforms, and the Ca2+-binding C2B-domain that is universally present in all neuronal and ubiquitous Munc13 isoforms. Note that in addition to binding to the C2B-domain, Ca2+ also serves to stimulate the production of DAG from PIP2 on the one hand, and the synthesis of DAG on the other hand.

Similar articles

Cited by

References

    1. Katz B. The release of neuronal transmitter substances. Liverpool University Press; Liverpool, UK: 1969.
    1. Abbott LF, Regehr WG. Synaptic computation. Nature. 2004;431:796–803. - PubMed
    1. Zucker RS, Regehr WG. Short-term synaptic plasticity. Annu. Rev. Physiol. 2002;64:355–405. - PubMed
    1. Mongillo G, Barak O, Tsodyks M. Synaptic theory of working memory. Science. 2008;319:1543–1546. - PubMed
    1. Brose N, Hofmann K, Hata Y, Südhof TC. Mammalian homologues of C. elegans unc-13 gene define novel family of C2-domain proteins. J. Biol. Chem. 1995;270:25273–25280. - PubMed

Publication types

MeSH terms