

Brain electrophysiological endophenotypes for externalizing psychopathology: a multivariate approach
- PMID: 20155392
- PMCID: PMC2830280
- DOI: 10.1007/s10519-010-9343-3
Brain electrophysiological endophenotypes for externalizing psychopathology: a multivariate approach
Abstract
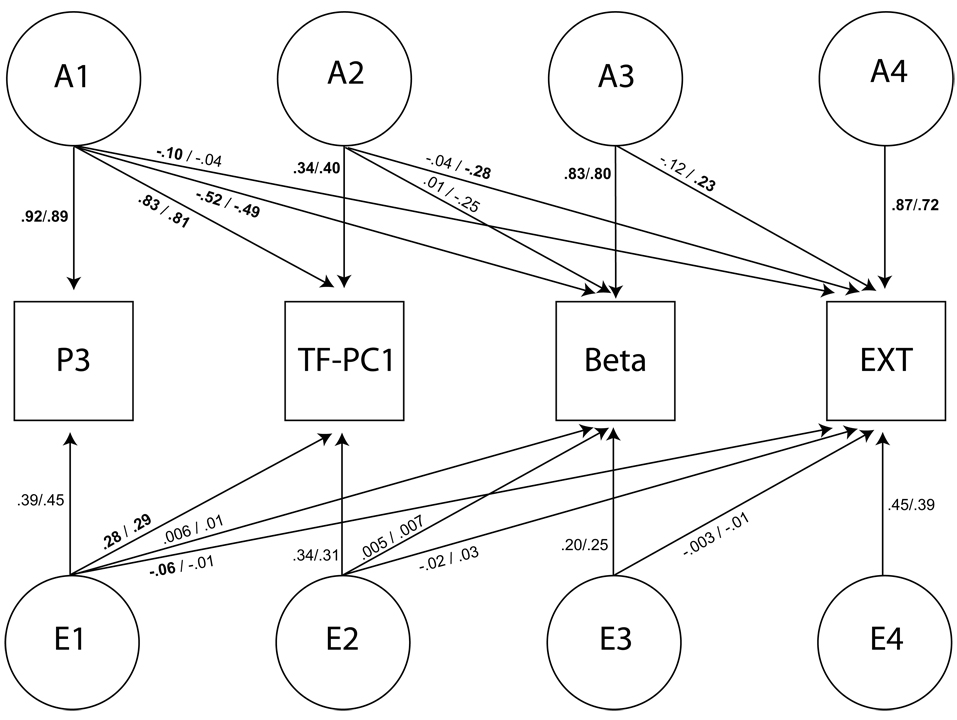
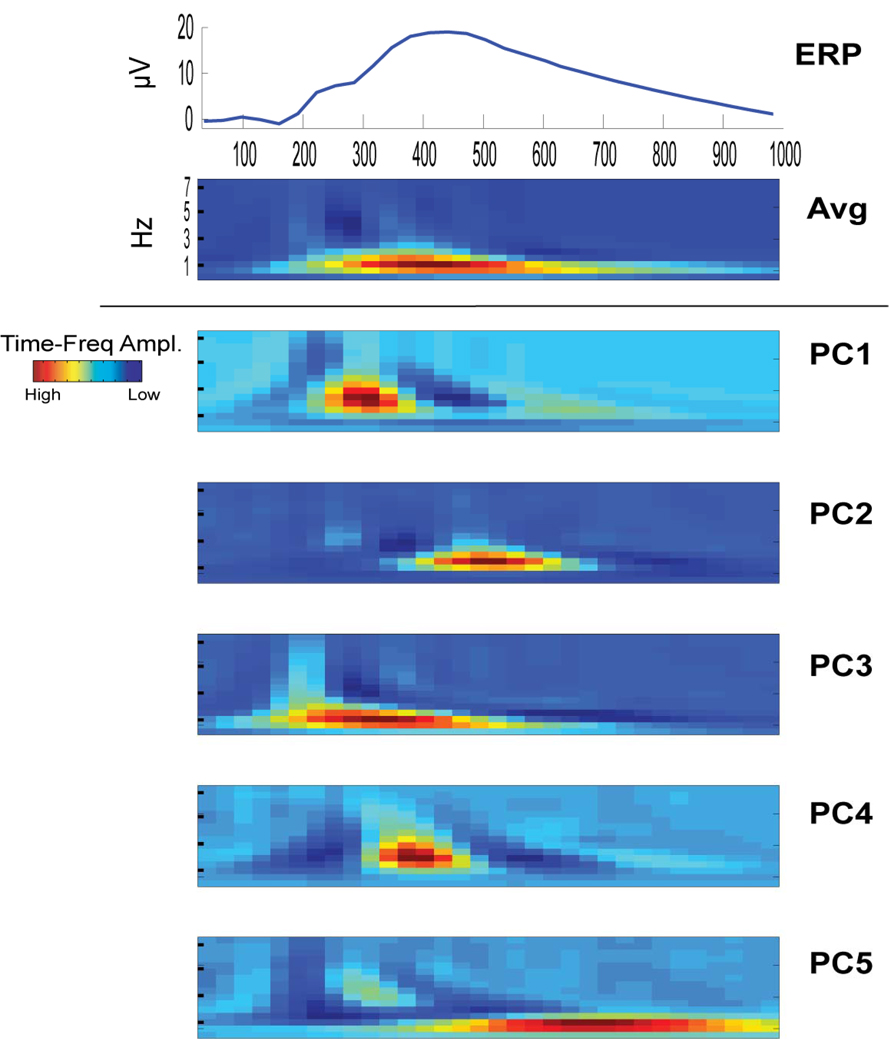
Abnormalities in electrophysiological measures of stimulus-evoked brain activity (including the P3 event-related potential (ERP) and its associated delta and theta time-frequency (TF) components), and intrinsic, resting state brain activity (including EEG in the beta frequency band) have each been associated with biological vulnerability to a variety of externalizing (EXT) spectrum disorders, such as substance use disorders, conduct disorder, and antisocial behavior. While each of these individual measures has shown promise as an endophenotype for one or more aspects of EXT, we proposed that the power to identify EXT-related genes may be enhanced by using these measures collectively. Thus, we sought to explore a multivariate approach to identifying electrophysiological endophenotypes related to EXT, using measures identified in the literature as promising individual endophenotypes for EXT. Using data from our large twin sample (634 MZ and 335 DZ, male and female same-sex pairs), and fitting multivariate biometric Cholesky models, we found that these measures (1) were heritable, (2) showed significant phenotypic and genetic correlation with a general vulnerability to EXT (which is itself highly heritable), (3) showed modest phenotypic and genetic correlation with each other, and (4) were sensitive to genetic effects that differed as a function of gender. These relationships suggest that these endophenotypes are likely tapping into neurophysiological processes and genes that are both common across them and unique to each-all of which are relevant to a biological vulnerability to EXT psychopathology.
Figures
Similar articles
-
Longitudinal stability and predictive utility of the visual P3 response in adults with externalizing psychopathology.Psychophysiology. 2015 Dec;52(12):1632-45. doi: 10.1111/psyp.12548. Epub 2015 Sep 24. Psychophysiology. 2015. PMID: 26402396 Free PMC article.
-
Is the P3 amplitude reduction seen in externalizing psychopathology attributable to stimulus sequence effects?Psychophysiology. 2012 Feb;49(2):248-51. doi: 10.1111/j.1469-8986.2011.01299.x. Epub 2011 Sep 19. Psychophysiology. 2012. PMID: 22092064 Free PMC article.
-
P300 event-related potential heritability in monozygotic and dizygotic twins.Psychophysiology. 1997 Jan;34(1):47-58. doi: 10.1111/j.1469-8986.1997.tb02415.x. Psychophysiology. 1997. PMID: 9009808
-
Substance use disorders, externalizing psychopathology, and P300 event-related potential amplitude.Int J Psychophysiol. 2003 May;48(2):147-78. doi: 10.1016/s0167-8760(03)00052-7. Int J Psychophysiol. 2003. PMID: 12763572 Review.
-
Twin and family studies of the human electroencephalogram: a review and a meta-analysis.Biol Psychol. 2002 Oct;61(1-2):111-38. doi: 10.1016/s0301-0511(02)00055-8. Biol Psychol. 2002. PMID: 12385672 Review.
Cited by
-
Genetic influences on composite neural activations supporting visual target identification.Biol Psychol. 2013 Feb;92(2):329-41. doi: 10.1016/j.biopsycho.2012.11.016. Epub 2012 Nov 29. Biol Psychol. 2013. PMID: 23201034 Free PMC article.
-
Endophenotype best practices.Int J Psychophysiol. 2017 Jan;111:115-144. doi: 10.1016/j.ijpsycho.2016.07.516. Epub 2016 Jul 27. Int J Psychophysiol. 2017. PMID: 27473600 Free PMC article. Review.
-
Target-related parietal P3 and medial frontal theta index the genetic risk for problematic substance use.Psychophysiology. 2019 Aug;56(8):e13383. doi: 10.1111/psyp.13383. Epub 2019 Apr 23. Psychophysiology. 2019. PMID: 31012496 Free PMC article.
-
A genome wide association study of fast beta EEG in families of European ancestry.Int J Psychophysiol. 2017 May;115:74-85. doi: 10.1016/j.ijpsycho.2016.12.008. Epub 2016 Dec 28. Int J Psychophysiol. 2017. PMID: 28040410 Free PMC article.
-
A construct-network approach to bridging diagnostic and physiological domains: application to assessment of externalizing psychopathology.J Abnorm Psychol. 2013 Aug;122(3):902-16. doi: 10.1037/a0032807. J Abnorm Psychol. 2013. PMID: 24016026 Free PMC article. Review.
References
-
- Agrawal A, Edenberg HJ, Foroud T, Bierut LJ, Dunne G, Hinrichs AL, et al. Association of GABRA2 with drug dependence in the collaborative study of the genetics of alcoholism sample. Behav Genet. 2006;36(5):640–650. - PubMed
-
- Akaike H. A new look at the statistical model identification. IEEE Transactions on Automatic Control. 1974;19(6):716–723.
-
- American Psychiatric Association. Diagnostic and statistical manual of mental disorders. 3rd ed., rev. Washington, D.C: Author; 1987.
-
- Arya R, Duggirala R, Williams JT, Almasy L, Blangero J. Power to localize the major gene for disease liability is increased after accounting for the effects of related quantitative phenotypes. Genet Epidemiol. 2001;21 Suppl 1:S774–S778. - PubMed
Publication types
MeSH terms
Grants and funding
LinkOut - more resources
Full Text Sources
Medical
Miscellaneous
