. 2010;73(5):445-61.
doi: 10.1080/15287390903489422.

Concept of assessing nanoparticle hazards considering nanoparticle dosemetric and chemical/biological response metrics

Affiliations

Concept of assessing nanoparticle hazards considering nanoparticle dosemetric and chemical/biological response metrics

Erik K Rushton et al. J Toxicol Environ Health A. 2010.

Abstract

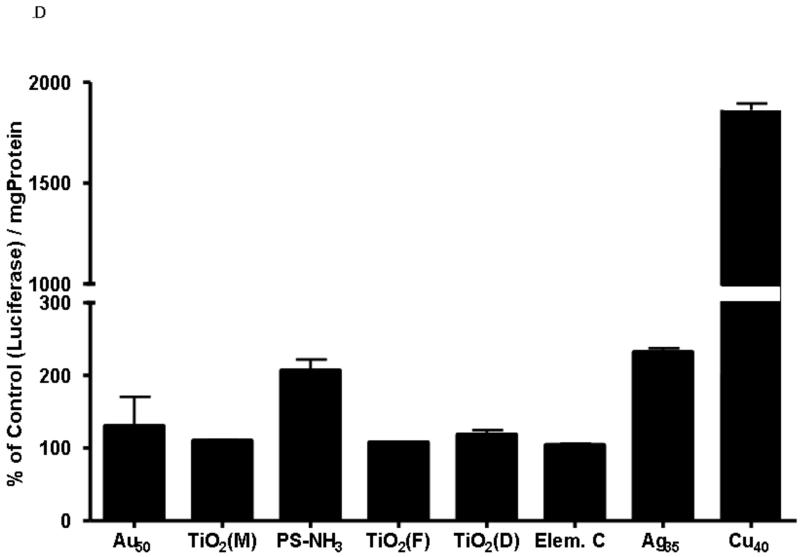
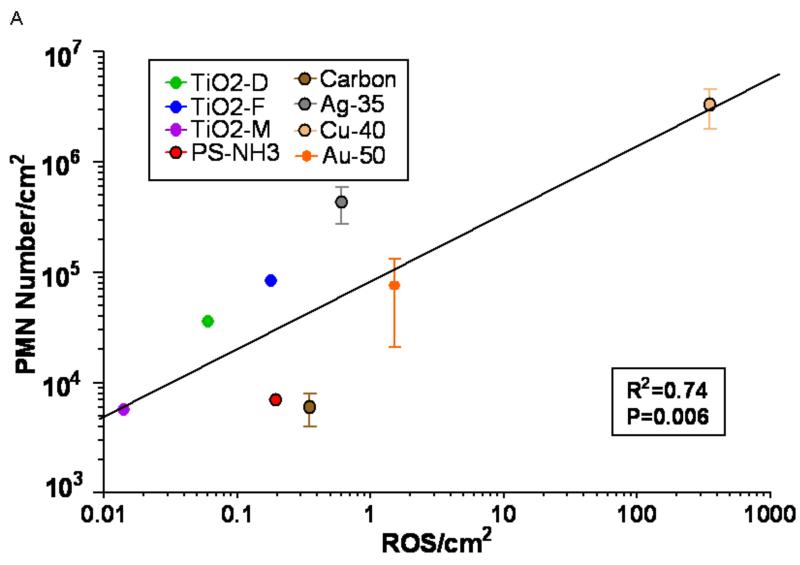
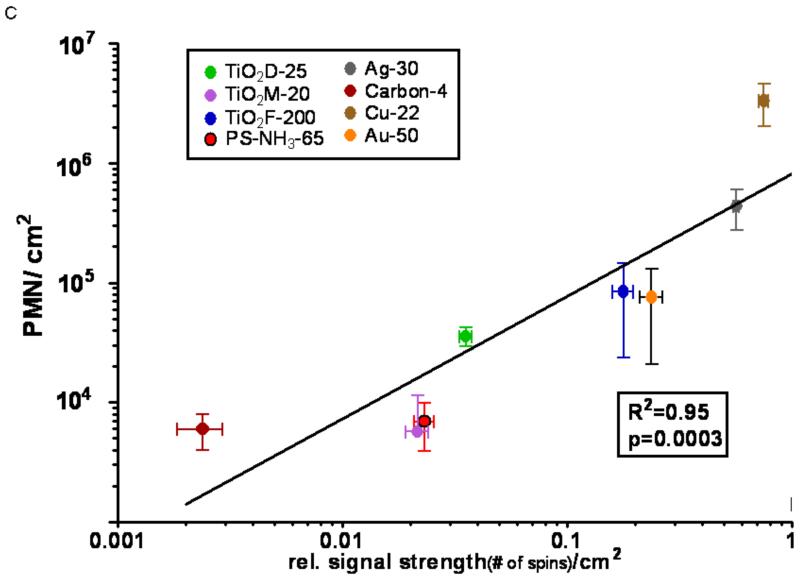
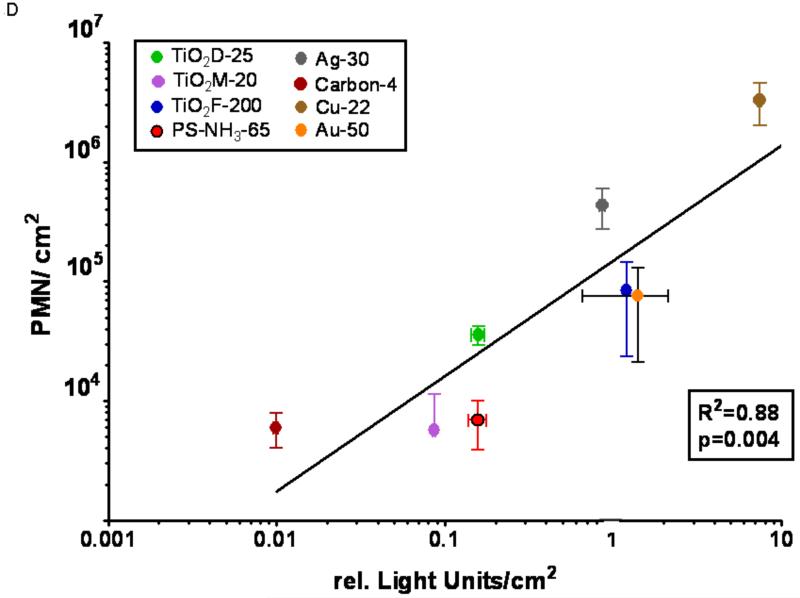
Engineered nanoparticles (NP) are being developed and incorporated in a number of commercial products, raising the potential of human exposure during manufacture, use, and disposal. Although data concerning the potential toxicity of some NP have been reported, validated simple assays are lacking for predicting their in vivo toxicity. The aim of this study was to evaluate new response metrics based on chemical and biological activity of NP for screening assays that can be used to predict NP toxicity in vivo. Two cell-free and two cell-based assays were evaluated for their power in predicting in vivo toxicity of eight distinct particle types with widely differing physicochemical characteristics. The cell-free systems comprised fluorescence- and electron spin resonance-based assays of oxidant activity. The cell-based systems also used electron spin resonance (ESR) as well as luciferase reporter activity to rank the different particle types in comparison to benchmark particles of low and high activity. In vivo experiments evaluated acute pulmonary inflammatory responses in rats. Endpoints in all assays were related to oxidative stress and responses were expressed per unit NP surface area to compare the results of different assays. Results indicated that NP are capable of producing reactive species, which in biological systems lead to oxidative stress. Copper NP had the greatest activity in all assays, while TiO(2) and gold NP generally were the least reactive. Differences in the ranking of NP activity among the assays were found when comparisons were based on measured responses. However, expressing the chemical (cell-free) and biological (cells; in vivo) activity per unit particle surface area showed that all in vitro assays correlated significantly with in vivo results, with the cellular assays correlating the best. Data from this study indicate that it is possible to predict acute in vivo inflammatory potential of NP with cell-free and cellular assays by using NP surface area-based dose and response metrics, but that a cellular component is required to achieve a higher degree of predictive power.


Figures

FIGURE 1
FIGURE 1
A: Cell-free ROS activity by different nanoparticles using DCF-DA fluorescence assay in a phosphate buffer. Data are expressed as H2O2 equivalent activity per μg of nanoparticles. B: Cell-free generation of hydroxyl radicals by different nanoparticles, determined by ESR. Results show ESR peak height (hydroxyl radical) for 10 mg/ml of each particle suspended in 1 ml PBS containing 1 mM H2O2 in the presence of DMPO. Inset shows a typical 1:2:2:1 hydroxyl radical spectrum. Bars represent average values (n = 3) ± standard error. C: Cellular generation of hydroxyl radical in the presence of different nanoparticles determined by ESR. Results show ESR peak height for 1 mg/ml of each particle after 5 min incubation with rat alveolar macrophages in PBS in the presence of DMPO. Inset shows a typical 1:2:2:1 hydroxyl radical spectrum from cells. Bars represent average values (n = 3) ± standard error. D: Luciferase production by A549 Luc-1 cells upon nanoparticle stimulation following 24-hr incubation at 9.5 μg/cm2. Bars represent average values (n = 3) ± standard error. *p < 0.05.
FIGURE 1
FIGURE 1
A: Cell-free ROS activity by different nanoparticles using DCF-DA fluorescence assay in a phosphate buffer. Data are expressed as H2O2 equivalent activity per μg of nanoparticles. B: Cell-free generation of hydroxyl radicals by different nanoparticles, determined by ESR. Results show ESR peak height (hydroxyl radical) for 10 mg/ml of each particle suspended in 1 ml PBS containing 1 mM H2O2 in the presence of DMPO. Inset shows a typical 1:2:2:1 hydroxyl radical spectrum. Bars represent average values (n = 3) ± standard error. C: Cellular generation of hydroxyl radical in the presence of different nanoparticles determined by ESR. Results show ESR peak height for 1 mg/ml of each particle after 5 min incubation with rat alveolar macrophages in PBS in the presence of DMPO. Inset shows a typical 1:2:2:1 hydroxyl radical spectrum from cells. Bars represent average values (n = 3) ± standard error. D: Luciferase production by A549 Luc-1 cells upon nanoparticle stimulation following 24-hr incubation at 9.5 μg/cm2. Bars represent average values (n = 3) ± standard error. *p < 0.05.
FIGURE 2
FIGURE 2
Pulmonary inflammatory response of nanoparticles determined by number of neutrophils (PMN) in lung lavage 24 hrs after intratracheal instillation of 100 μg (25 μg for copper NPs) in rats. Bars represent average values (n = 3-5) ± standard error. *p < 0.05.
FIGURE 3
FIGURE 3
Correlations between in vivo inflammatory response (number of PMN) and responses observed in cell-free and cellular assays. A box contains the results of correlation analysis with the particle surface area based response-metric (response/cm2); the R2 of the Spearman correlation and the significance (p) of the linear fit model. A: Cell-free (DCFH oxidation) ROS activity/cm2 vs. in vivo PMN response/cm2. B: Cell-free ESR (DMPO spin trapping) activity/cm2 vs. in vivo PMN response/cm2. C: Alveolar macrophage ESR (DMPO spin trapping) activity/cm2 vs. in vivo PMN response/cm2. D: A549 Luc-1 cell luciferase response/cm2 vs. in vivo PMN response/cm2.
FIGURE 3
FIGURE 3
Correlations between in vivo inflammatory response (number of PMN) and responses observed in cell-free and cellular assays. A box contains the results of correlation analysis with the particle surface area based response-metric (response/cm2); the R2 of the Spearman correlation and the significance (p) of the linear fit model. A: Cell-free (DCFH oxidation) ROS activity/cm2 vs. in vivo PMN response/cm2. B: Cell-free ESR (DMPO spin trapping) activity/cm2 vs. in vivo PMN response/cm2. C: Alveolar macrophage ESR (DMPO spin trapping) activity/cm2 vs. in vivo PMN response/cm2. D: A549 Luc-1 cell luciferase response/cm2 vs. in vivo PMN response/cm2.
FIGURE 4
FIGURE 4
Determining the steepest slope as a measure of the response-metric (greatest response per unit dose) from in vitro and in vivo dose-response curves. The response-metric based on particle surface area as the dose-metric is a more appropriate measure to determine in vitro/in vivo correlations than using the highest observed response (yn) elicited by an unrealistic high dose xn.
FIGURE 5
FIGURE 5
Re-analysis of in vivo/in vitro correlations of responses of different particles based on dose-relationships observed at 24 hrs following in vitro dosing of lung cells and in vitro intratracheal instillations of rats, reported by Sayes et al. (2007). For the re-analysis of the data, the in vivo and in vitro responses were either compared based on their highest values as directly determined in the assays (Figs. 5A, C) or they were based on the highest response per unit particle surface area (concept of biological response-metric) calculated from the steepest part of the in vitro and in vivo dose-response relationships (Figs. 5B, D). Associated Spearman correlations and p-values for significance of linear fit show that expressing in vitro data as surface area based response-metrics (derived from steepest slope of dose-response data) has a good predictive power for in vivo responses. A: In vivo (number of PMNs in rat lung lavage) vs. in vitro (rat alveolar macrophage induction of MIP-2) correlation, using the highest measured response elicited with high doses of the different particles. B: In vivo (number of PMNs/cm2 in rat lung lavage) vs. in vitro (rat alveolar macrophage induction of MIP-2/cm2) correlation, using the highest response per unit particle surface area. (Note: crystalline silica and amorphous silica are clearly separated in 5B, but not in 5A). C: In vivo (number of PMNs in rat lung lavage) vs. in vitro (release of LDH in rat alveolar macrophage + rat type 2 cell-line co-culture) correlation, using the highest measured response elicited with high doses of the different particles. D: In vivo (number of PMNs/cm2 in rat lung lavage) vs. in vitro (release of LDH/cm2 in rat alveolar macrophage + rat type 2 cell-line co-culture) correlation, using the highest response per unit particle surface area.
FIGURE 5
FIGURE 5
Re-analysis of in vivo/in vitro correlations of responses of different particles based on dose-relationships observed at 24 hrs following in vitro dosing of lung cells and in vitro intratracheal instillations of rats, reported by Sayes et al. (2007). For the re-analysis of the data, the in vivo and in vitro responses were either compared based on their highest values as directly determined in the assays (Figs. 5A, C) or they were based on the highest response per unit particle surface area (concept of biological response-metric) calculated from the steepest part of the in vitro and in vivo dose-response relationships (Figs. 5B, D). Associated Spearman correlations and p-values for significance of linear fit show that expressing in vitro data as surface area based response-metrics (derived from steepest slope of dose-response data) has a good predictive power for in vivo responses. A: In vivo (number of PMNs in rat lung lavage) vs. in vitro (rat alveolar macrophage induction of MIP-2) correlation, using the highest measured response elicited with high doses of the different particles. B: In vivo (number of PMNs/cm2 in rat lung lavage) vs. in vitro (rat alveolar macrophage induction of MIP-2/cm2) correlation, using the highest response per unit particle surface area. (Note: crystalline silica and amorphous silica are clearly separated in 5B, but not in 5A). C: In vivo (number of PMNs in rat lung lavage) vs. in vitro (release of LDH in rat alveolar macrophage + rat type 2 cell-line co-culture) correlation, using the highest measured response elicited with high doses of the different particles. D: In vivo (number of PMNs/cm2 in rat lung lavage) vs. in vitro (release of LDH/cm2 in rat alveolar macrophage + rat type 2 cell-line co-culture) correlation, using the highest response per unit particle surface area.

Similar articles

Cited by

References

    1. Auger F, Gendron MC, Chamot C, Marano F, Dazy AC. Responses of well-differentiated nasal epithelial cells exposed to particles: role of the epithelium in airway inflammation. Toxicol Appl Pharmacol. 2006;215(3):285–94. - PubMed
    1. Balbus JM, Maynard AD, Colvin VL, Castranova V, Daston GP, Denison RA, Dreher KL, Goering PL, Goldberg AM, Kulinowski KM, Monteiro-Riviere NA, Oberdorster G, Omenn GS, Pinkerton KE, Ramos KS, Rest KM, Sass JB, Silbergeld EK, Wong BA. Meeting report: hazard assessment for nanoparticles--report from an interdisciplinary workshop. Environ Health Perspect. 2007;115(11):1654–9. - PMC - PubMed
    1. Barrett EG, Johnston C, Oberdorster G, Finkelstein JN. Silica binds serum proteins resulting in a shift of the dose-response for silica-induced chemokine expression in an alveolar type II cell line. Toxicol Appl Pharmacol. 1999;161(2):111–22. - PubMed
    1. Borm PJ, Robbins D, Haubold S, Kuhlbusch T, Fissan H, Donaldson K, Schins R, Stone V, Kreyling W, Lademann J, Krutmann J, Warheit D, Oberdorster E. The potential risks of nanomaterials: a review carried out for ECETOC. Part Fibre Toxicol. 2006;3:11. - PMC - PubMed
    1. Brown DM, Hutchison L, Donaldson K, MacKenzie SJ, Dick CA, Stone V. The effect of oxidative stress on macrophages and lung epithelial cells: the role of phosphodiesterases 1 and 4. Toxicol Lett. 2007;168(1):1–6. - PubMed

Publication types

LinkOut - more resources