

doi: 10.1186/gb-2010-11-2-r18.
Epub 2010 Feb 15.
A fuzzy gene expression-based computational approach improves breast cancer prognostication
Affiliations
- PMID: 20156340
- PMCID: PMC2872878
- DOI: 10.1186/gb-2010-11-2-r18
Item in Clipboard
A fuzzy gene expression-based computational approach improves breast cancer prognostication
Genome Biol.
2010.
Abstract
Early gene expression studies classified breast tumors into at least three clinically relevant subtypes. Although most current gene signatures are prognostic for estrogen receptor (ER) positive/human epidermal growth factor receptor 2 (HER2) negative breast cancers, few are informative for ER negative/HER2 negative and HER2 positive subtypes. Here we present Gene Expression Prognostic Index Using Subtypes (GENIUS), a fuzzy approach for prognostication that takes into account the molecular heterogeneity of breast cancer. In systematic evaluations, GENIUS significantly outperformed current gene signatures and clinical indices in the global population of patients.
Figures

Risk prediction model design (GENIUS). Design of the fuzzy approach used to build the new risk prediction model, called GENIUS (Gene Expression progNostic Index Using Subtypes): (a) training phase to build GENIUS; (b) validation phase to test GENIUS in the independent dataset of untreated breast cancer patients. For the sake of clarity, we denoted P(ER-/HER2-), P(HER2+) and P(ER+/HER2-) by P(1), P(2) and P(3), respectively.
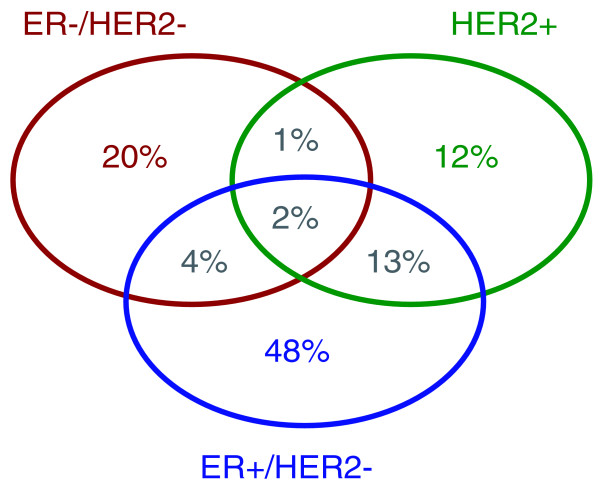
Proportion of subtypes in primary breast tumors. Venn diagram of proportions of the three molecular subtypes identified in a database of 3,537 breast cancer patients. We considered a threshold of 1% for the uncertainty of a patient belonging to a specific subtype. Therefore, patients have a tumor of a unique subtype if the posterior probability of belonging to that subtype exceeds 99%.

Time-dependent ROC curves at 5 years for the risk score predictions computed by GENIUS and AURKA. Training set: in the (a) global population of breast cancer patients, to illustrate the cutoff selected for risk group prediction (green lines). Validation set: in the (b) global population, the (c) ER+/HER2-, (d) ER-/HER2- and (e) HER2+ subtypes. AUC, area under the curve.
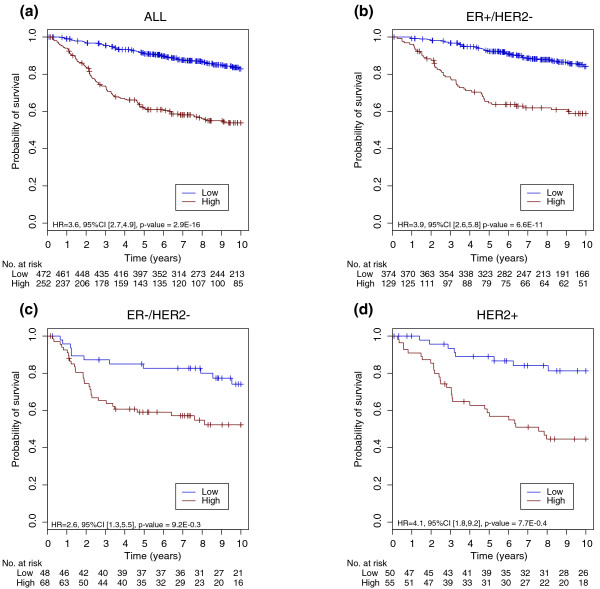
Survival curves for GENIUS risk group predictions. Kaplan-Meier survival curves for GENIUS risk group predictions in the (a) global population, the (b) ER+/HER2-, (c) ER-/HER2- and (d) HER2+ subtypes of the validation set.

Forest plot of the concordance indices for GENIUS and GENIUS CRISP. Forest plot of the concordance indices for GENIUS and GENIUS CRISP risk predictions, with respect to the subtypes in the validation set: (a) risk score predictions; (b) risk group predictions. The P-values at the right-hand side of the forest plot were computed from the statistical test of superiority of GENIUS.
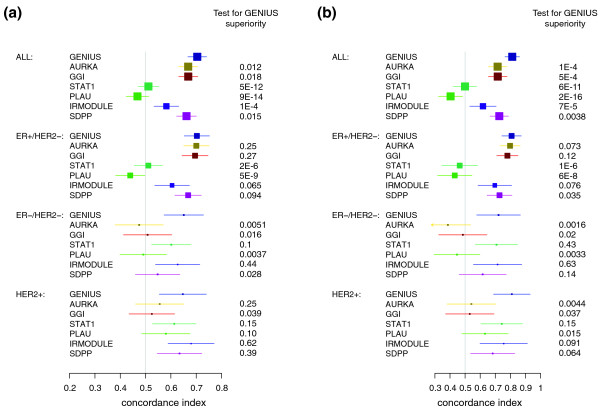
Forest plot of the concordance indices for GENIUS and the state-of-the-art prognostic signatures. Forest plot of the concordance indices for GENIUS and the current prognostic signatures (AURKA, GGI, STAT1, PLAU, IRMODULE and SDPP) risk predictions, with respect to the subtypes in the validation set: (a) risk score predictions; (b) risk group predictions. The P-values at the right-hand side of the forest plot were computed from the statistical test of superiority of GENIUS.
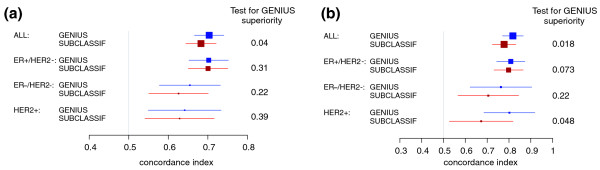
Forest plot of the concordance indices for GENIUS and SUBCLASSIF. Forest plot of the concordance indices for GENIUS and GENIUS CRISP risk predictions, with respect to the subtypes in the validation set: (a) risk score predictions; (b) risk group predictions. The P-values at the right-hand side of the forest plot were computed from the statistical test of superiority of GENIUS.
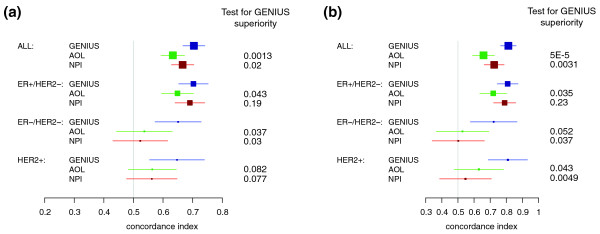
Forest plot of the concordance indices for GENIUS and the clinical prognostic indices. Forest plot of the concordance indices for GENIUS and the clinical prognostic indices (AOL and NPI) risk predictions with respect to the subtypes in the validation set: (a) risk score predictions; (b) risk group predictions. The P-values at the right-hand side of the forest plot were computed from the statistical test of superiority of GENIUS.

Survival curves for the combination of GENIUS and the clinical prognostic indices risk group predictions. Kaplan-Meier survival curves for the combination of GENIUS and AOL/NPI predictions in the (a) AOL and (b) NPI global population, the (c) AOL and (d) NPI ER+/HER2-, the (e) AOL and (f) AOL ER-/HER2- and the (g) AOL and (h) NPI HER2+ subtypes of the validation set.

Study of six breast cancer cases highlighting benefits of using GENIUS. (a-f) Six cases of breast cancer patients from TBG dataset (breast cancer microarray dataset introduced by Desmedt et al. [34]) where prognostic clinical indices and gene signatures are compared to GENIUS. The boxes contain relevant comments highlighting the benefits of using GENIUS
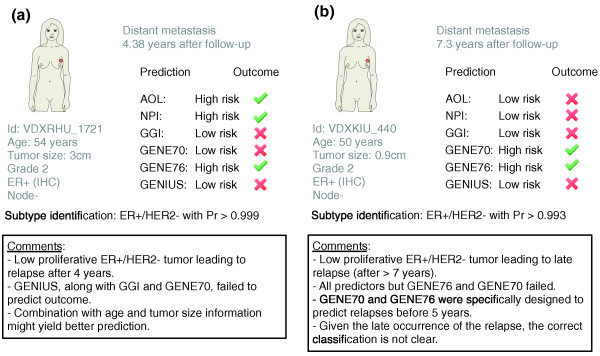
Study of two breast cancer cases highlighting drawbacks of using GENIUS. (a,b) Two cases of breast cancer patients from the TBG dataset (breast cancer microarray dataset introduced by Desmedt et al. [34]) where prognostic clinical indices and gene signatures are compared to GENIUS. The boxes contain relevant comments highlighting the drawbacks of using GENIUS.
Similar articles
-
Identification of subtypes in human epidermal growth factor receptor 2--positive breast cancer reveals a gene signature prognostic of outcome.J Clin Oncol. 2010 Apr 10;28(11):1813-20. doi: 10.1200/JCO.2009.22.8775. Epub 2010 Mar 15. J Clin Oncol. 2010. PMID: 20231686
-
Comparison of MammaPrint and TargetPrint results with clinical parameters in German patients with early stage breast cancer.Int J Mol Med. 2010 Dec;26(6):837-43. doi: 10.3892/ijmm_00000532. Int J Mol Med. 2010. PMID: 21042777
-
Fuzzy logic selection as a new reliable tool to identify molecular grade signatures in breast cancer--the INNODIAG study.BMC Med Genomics. 2015 Feb 7;8:3. doi: 10.1186/s12920-015-0077-1. BMC Med Genomics. 2015. PMID: 25888889 Free PMC article.
-
The multigene classifiers 95GC/42GC/155GC for precision medicine in ER-positive HER2-negative early breast cancer.Cancer Sci. 2021 Apr;112(4):1369-1375. doi: 10.1111/cas.14838. Epub 2021 Feb 26. Cancer Sci. 2021. PMID: 33544932 Free PMC article. Review.
-
Linkage between EGFR family receptors and nuclear factor kappaB (NF-kappaB) signaling in breast cancer.J Cell Physiol. 2006 Dec;209(3):645-52. doi: 10.1002/jcp.20785. J Cell Physiol. 2006. PMID: 17001676 Review.
Cited by
-
Uncovering the roles of microRNAs/lncRNAs in characterising breast cancer subtypes and prognosis.BMC Bioinformatics. 2021 Jun 4;22(1):300. doi: 10.1186/s12859-021-04215-3. BMC Bioinformatics. 2021. PMID: 34082714 Free PMC article.
-
Nuclear PDCD4 Expression Defines a Subset of Luminal B-Like Breast Cancers with Good Prognosis.Horm Cancer. 2020 Oct;11(5-6):218-239. doi: 10.1007/s12672-020-00392-4. Epub 2020 Jul 6. Horm Cancer. 2020. PMID: 32632815 Free PMC article.
-
MicroRNA-mRNA networks define translatable molecular outcome phenotypes in osteosarcoma.Sci Rep. 2020 Mar 10;10(1):4409. doi: 10.1038/s41598-020-61236-3. Sci Rep. 2020. PMID: 32157112 Free PMC article.
-
Clinical and multiple gene expression variables in survival analysis of breast cancer: analysis with the hypertabastic survival model.BMC Med Genomics. 2012 Dec 14;5:63. doi: 10.1186/1755-8794-5-63. BMC Med Genomics. 2012. PMID: 23241496 Free PMC article.
-
Correlation between MR Image-Based Radiomics Features and Risk Scores Associated with Gene Expression Profiles in Breast Cancer.Taehan Yongsang Uihakhoe Chi. 2020 May;81(3):632-643. doi: 10.3348/jksr.2020.81.3.632. Epub 2020 May 29. Taehan Yongsang Uihakhoe Chi. 2020. PMID: 36238609 Free PMC article.
References
-
- Hu Z, Fan C, Oh DS, Marron JS, He X, Qaqish BF, Livasy C, Carey LA, Reynolds E, Dressler L, Nobel A, Parker J, Ewend MG, Sawyer LR, Wu J, Liu Y, Nanda R, Tretiakova M, Ruiz Orrico A, Dreher D, Palazzo JP, Perreard L, Nelson E, Mone M, Hansen H, Mullins M, Quackenbush JF, Ellis MJ, Olopade OI, Bernard PS. The molecular portraits of breast tumors are conserved across microarray platforms. BMC Genomics. 2006;7:96. doi: 10.1186/1471-2164-7-96. - DOI - PMC - PubMed
-
- Perou CM, Sorlie T, Eisen MB, Rijn M van de, Jeffrey SS, Rees CA, Pollack JR, Ross DT, Johnsen H, Akslen LA, Fluge O, Pergamenschikov A, Williams C, Zhu SX, Lonning PE, Borresen-Dale AL, Brown PO, Botstein D. Molecular portraits of human breast tumours. Nature. 2000;406:747–752. doi: 10.1038/35021093. - DOI - PubMed
-
- Sorlie T, Perou CM, Tibshirani R, Aas T, Geisler S, Johnsen H, Hastie T, Eisen MB, Rijn M van de, Jeffrey SS, Thorsen T, Quist H, Matese JC, Brown PO, Botstein D, Eystein Lonning P, Borresen-Dale AL. Gene expression patterns of breast carcinomas distinguish tumor subclasses with clinical implications. Proc Natl Acad Sci USA. 2001;98:10869–10874. doi: 10.1073/pnas.191367098. - DOI - PMC - PubMed
-
- Sorlie T, Tibshirani R, Parker J, Hastie T, Marron JS, Nobel A, Deng S, Johnsen H, Pesich R, Geisler S, Demeter J, Perou CM, Lonning PE, Brown PO, Borresen-Dale AL, Botstein D. Repeated observation of breast tumor subtypes in independent gene expression data sets. Proc Natl Acad Sci USA. 2003;100:8418–8423. doi: 10.1073/pnas.0932692100. - DOI - PMC - PubMed
Publication types
MeSH terms
Substances
LinkOut - more resources
Full Text Sources
Medical
Molecular Biology Databases
Research Materials
Miscellaneous
