. 2010 Feb 15:11:15.
doi: 10.1186/1471-2199-11-15.

Validation of reference genes for gene expression analysis in chicory (Cichorium intybus) using quantitative real-time PCR

Affiliations

Validation of reference genes for gene expression analysis in chicory (Cichorium intybus) using quantitative real-time PCR

Asad Maroufi et al. BMC Mol Biol. .

Abstract

Background: Quantitative real-time reverse transcriptase polymerase chain reaction (qRT-PCR) is a sensitive technique for quantifying gene expression levels. One or more appropriate reference genes must be selected to accurately compare mRNA transcripts across different samples and tissues. Thus far, only actin-2 has been used as a reference gene for qRT-PCR in chicory, and a full comparison of several candidate reference genes in chicory has not yet been reported.

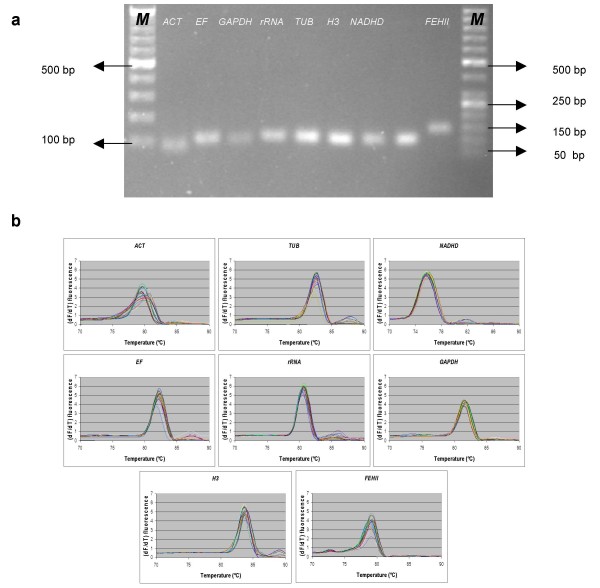
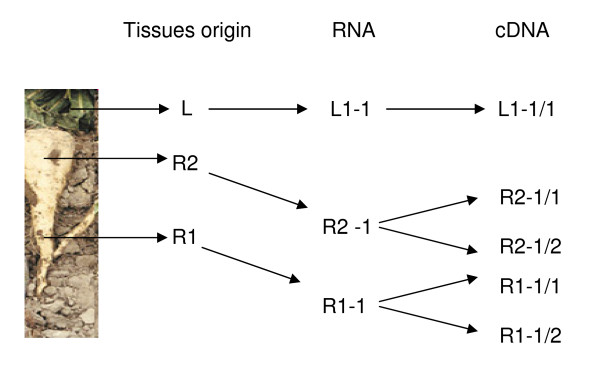
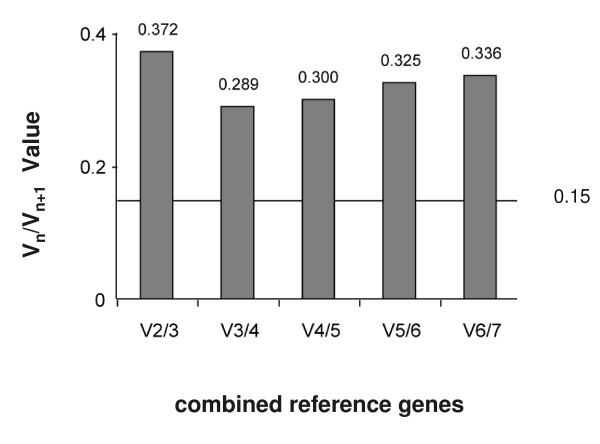
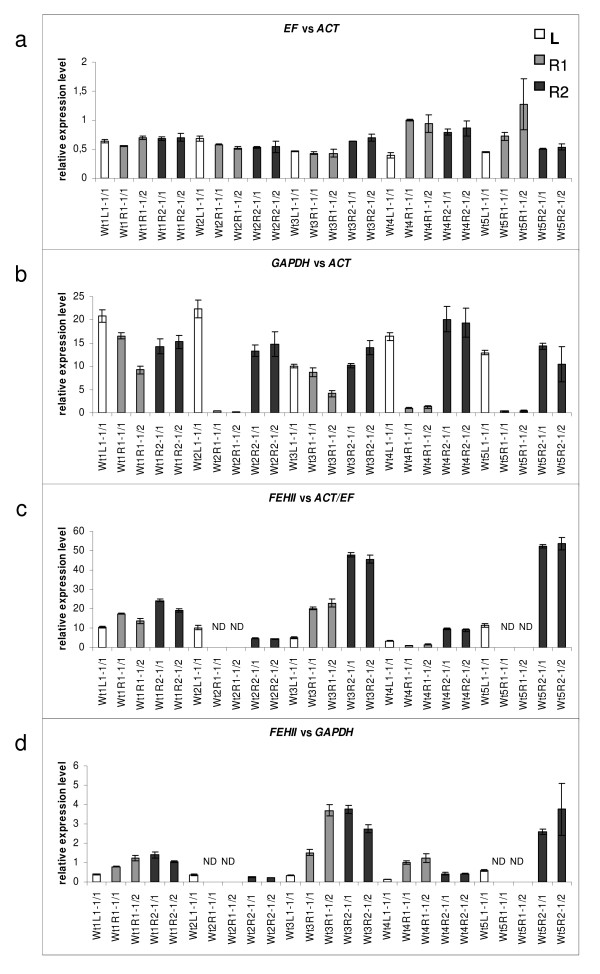
Results: Seven candidate reference genes, including nicotinamide adenine dinucleotide dehydrogenase (NADHD), actin (ACT), beta-tubulin (TUB), glyceraldehyde-3-phosphate-dehydrogenase (GADPH), histone H3 (H3), elongation factor 1-alpha (EF) and 18S rRNA (rRNA) were selected to study the expression stability for normalisation of gene expression in chicory. Primer specificity and amplification efficiency were verified for each gene. The expression stability of these genes was analysed across chicory root and leaf tissues using geNorm, NormFinder and BestKeeper software. ACT, EF, and rRNA were the most stable genes as identified by the three different analysis methods. In addition, the use of ACT, EF and GAPDH as reference genes was illustrated by analysing 1-FEHII (FEHII) expression in chicory root and leaf tissues. These analyses revealed the biological variation in FEHII transcript expression among the tissues studied, and between individual plants.

Conclusions: geNorm, NormFinder, and BestKeeper analyses indicated that ACT, EF and rRNA had the highest expression stability across leaf and root tissues, while GAPDH and NADHD showed relatively low expression stability. The results of this study emphasise the importance of validating reference genes for qRT-PCR analysis in chicory. The use of the most stable reference genes such as ACT and EF allows accurate normalisation of gene expression in chicory leaf and root tissues.


Figures

Figure 1
Figure 1
Confirmation of amplicon size and primer specificity of studied genes. (a) Agarose gel electrophoresis showing specific reverse transcription PCR products of the expected size for each gene, (b) Melting curves generated for all genes. M represents DNA size marker.
Figure 2
Figure 2
Schematic diagram illustrating different tissues origin used for RNA extraction and labelling of RNA and cDNA samples used for qRT-PCR.
Figure 3
Figure 3
Determination of the optimal number of reference genes calculated by geNorm. Determination of the optimal number of reference genes for accurate normalisation of gene expression. Average pairwise variations Vn/Vn+1 are calculated between the normalisation factors NFn and NFn+1 to indicate whether inclusion of extra reference gene adds to the stability of the normalisation factor.
Figure 4
Figure 4
The relative expression level of EF, GAPDH and FEHII in chicory leaf and root. (a) EF normalised by ACT, (b) GAPDH normalised by ACT, (c) FEHII normalised by combined normalisation factor using ACT and EF and (d) FEHII normalised by GAPDH in young green leaf (L) and root tissues (R) of five wild type (Wt) chicory plants. Data are obtained from two independent RNA extractions for leaf tissue and two independent cDNA syntheses for R1 and R2 tissues. Expression profiles are calculated in qBase using selected reference genes and the gene specific amplification efficiency. Wt4-R1-1 as calibrator, ND: FEHII transcript was not detected in respective samples. Error bars represent standard error of the mean (white bars L samples, gray bars R1 samples and black R2 samples).

Similar articles

Cited by

References

    1. Bustin SA. Quantification of mRNA using real-time reverse transcription PCR (RT-PCR): trends and problems. J Mol Endocrinol. 2002;29:23–39. doi: 10.1677/jme.0.0290023. - DOI - PubMed
    1. Ginzinger DG. Gene quantification using real-time quantitative PCR: an emerging technology hits the mainstream. Exp Hematol. 2002;30:503–512. doi: 10.1016/S0301-472X(02)00806-8. - DOI - PubMed
    1. Bustin SA, Dorudi S. Molecular assessment of tumour stage and disease recurrence using PCR-based assays. Mol Med Today. 1998;4:389–396. doi: 10.1016/S1357-4310(98)01324-0. - DOI - PubMed
    1. Bustin SA. Absolute quantification of mRNA using real-time reverse transcription polymerase chain reaction assays. J Mol Endocrinol. 2000;25:169–193. doi: 10.1677/jme.0.0250169. - DOI - PubMed
    1. Gachon C, Mingam A, Charrier B. Real-time PCR: what relevance to plant studies? J Exp Bot. 2004;55:1445–1454. doi: 10.1093/jxb/erh181. - DOI - PubMed

Publication types

MeSH terms