. 2010 Jul 1;316(11):1871-84.
doi: 10.1016/j.yexcr.2010.02.008. Epub 2010 Feb 13.

Hypoglycosylated E-cadherin promotes the assembly of tight junctions through the recruitment of PP2A to adherens junctions

Affiliations

Hypoglycosylated E-cadherin promotes the assembly of tight junctions through the recruitment of PP2A to adherens junctions

Mihai Nita-Lazar et al. Exp Cell Res. .

Abstract

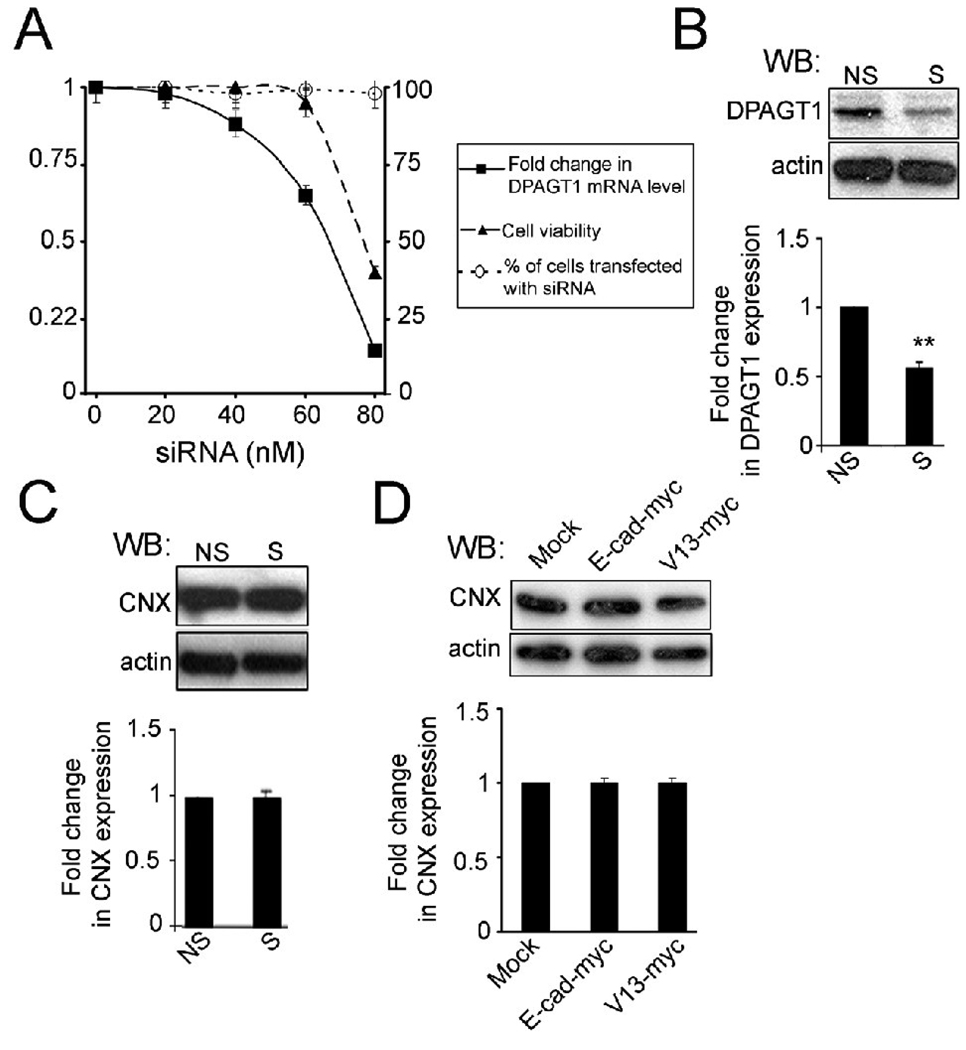
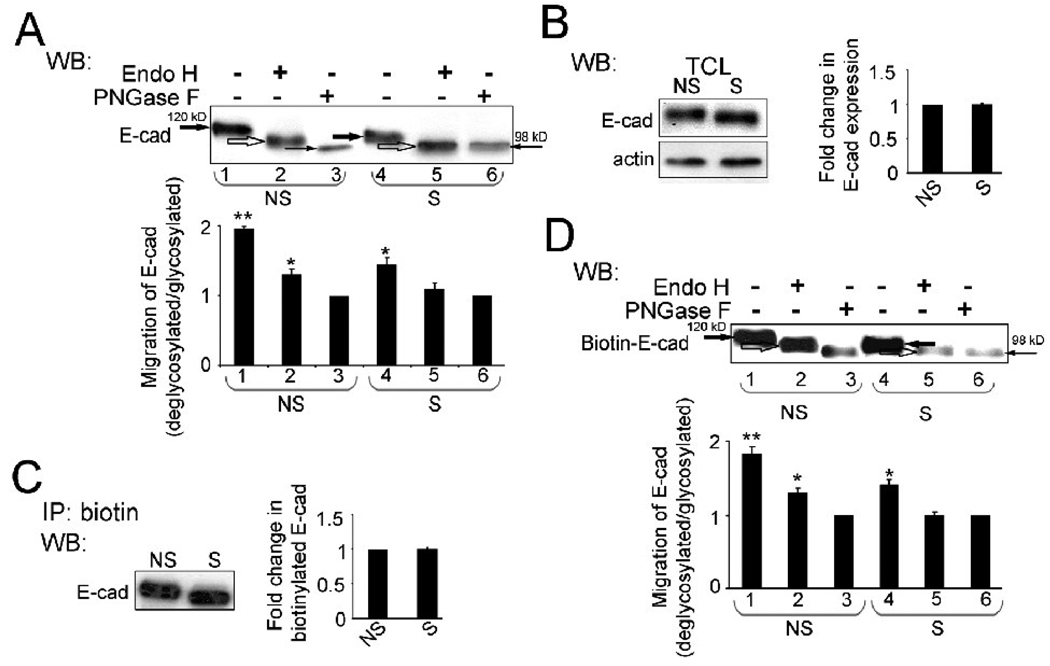
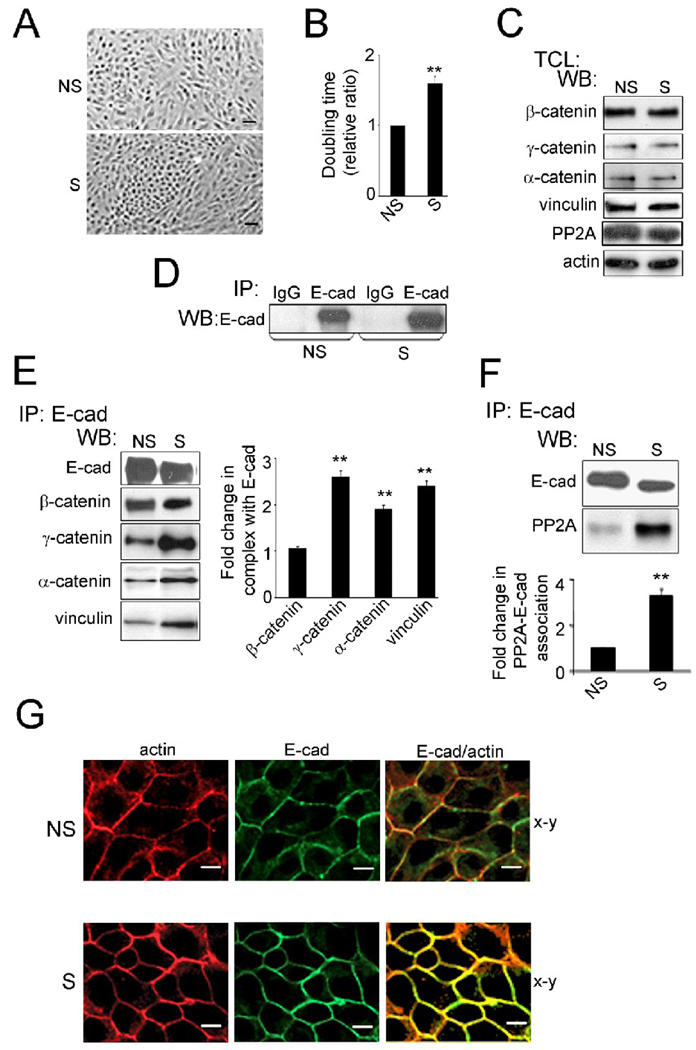
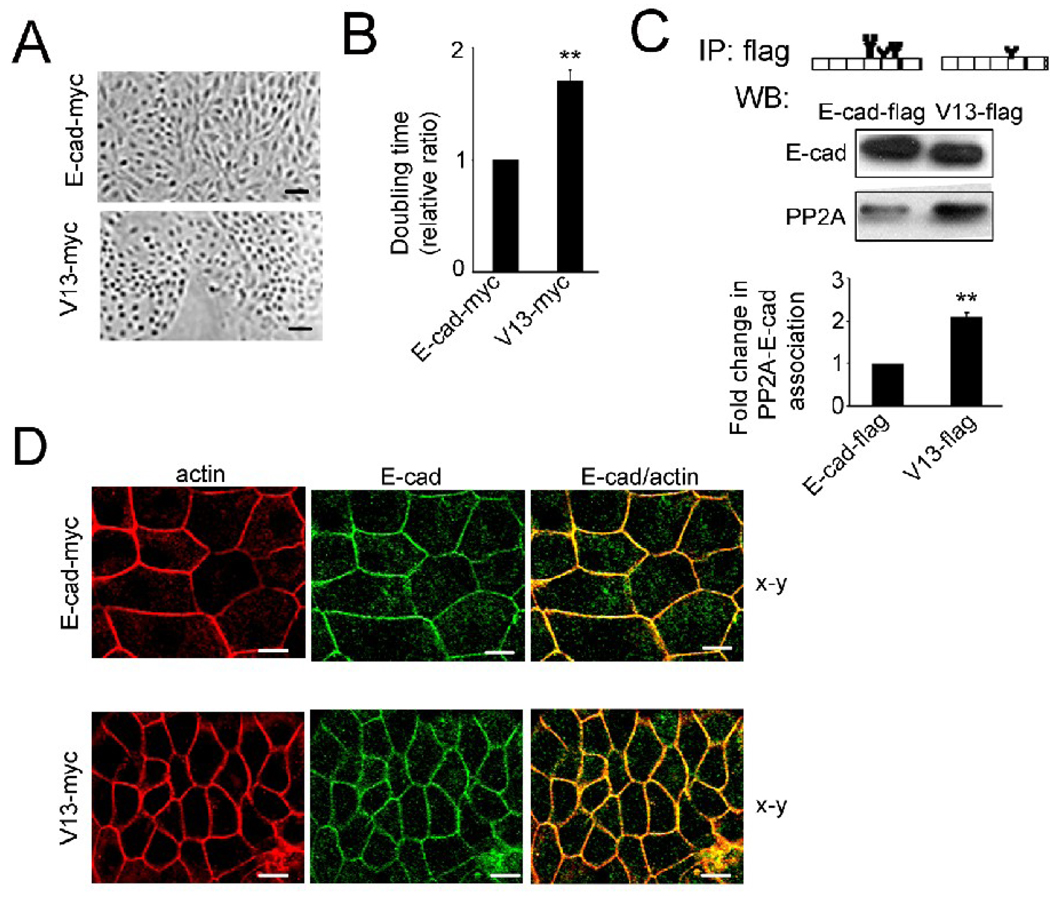
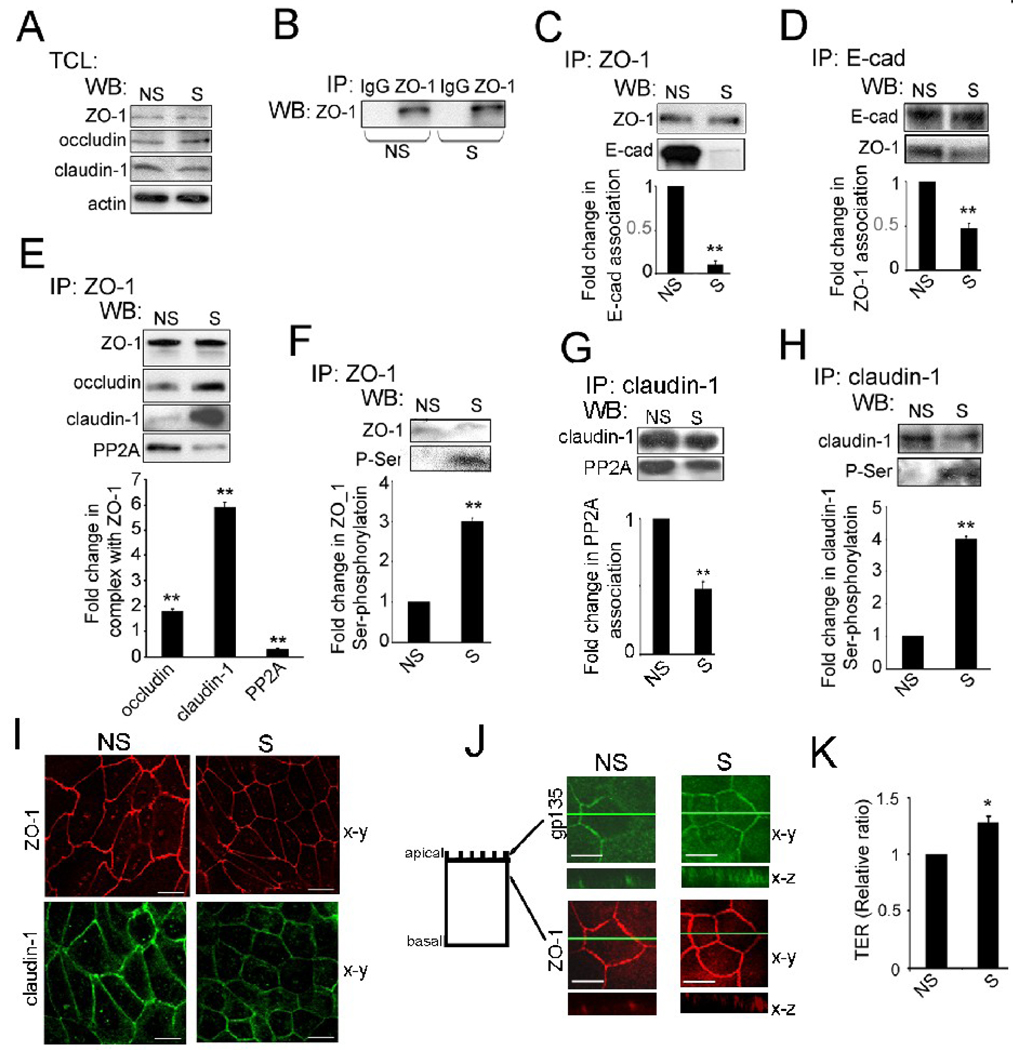
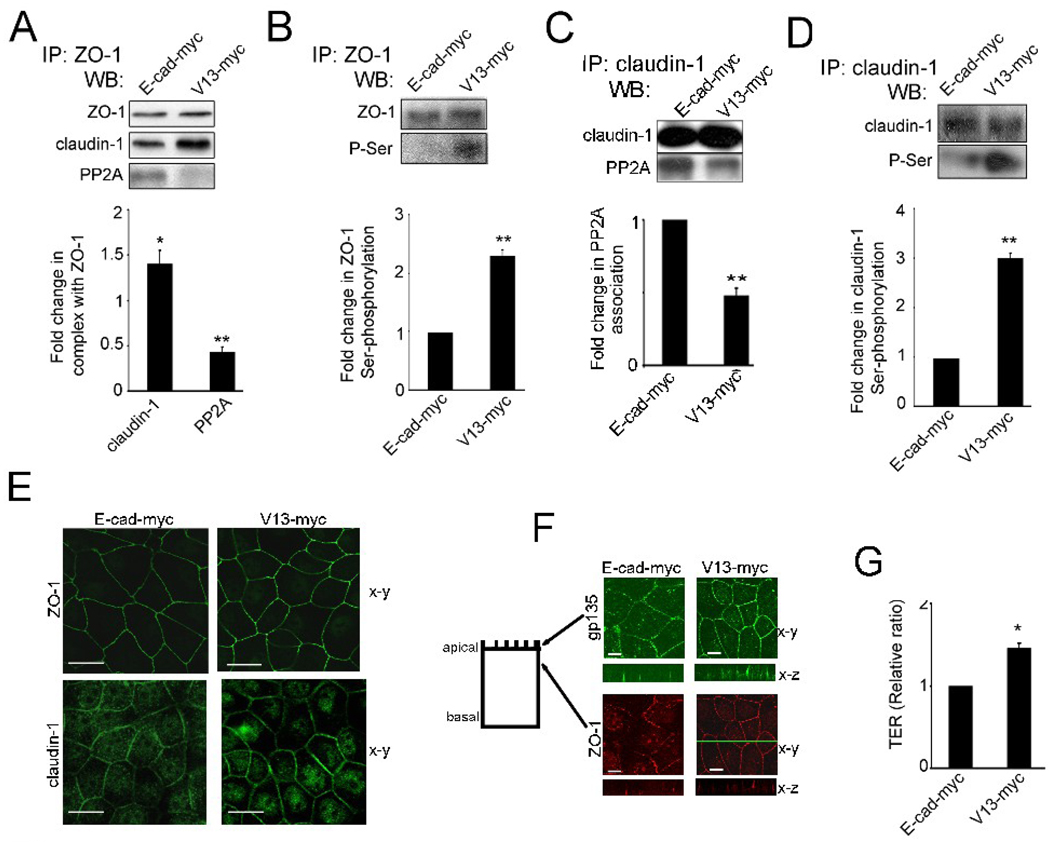
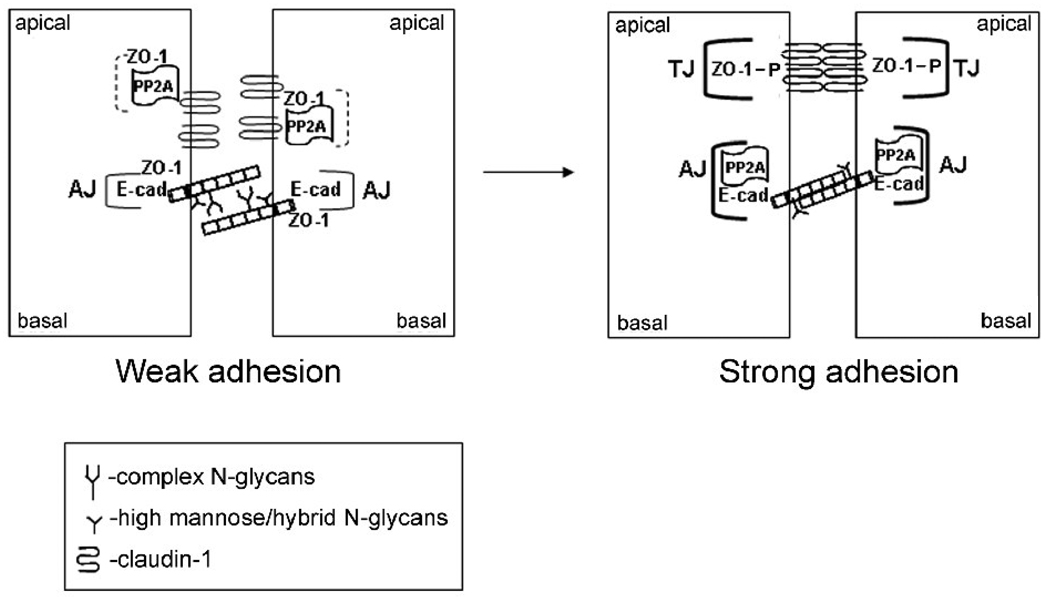
Epithelial cell-cell adhesion is controlled by multiprotein complexes that include E-cadherin-mediated adherens junctions (AJs) and ZO-1-containing tight junctions (TJs). Previously, we reported that reduction of E-cadherin N-glycosylation in normal and cancer cells promoted stabilization of AJs through changes in the composition and cytoskeletal association of E-cadherin scaffolds. Here, we show that enhanced interaction of hypoglycosylated E-cadherin-containing AJs with protein phosphatase 2A (PP2A) represents a mechanism for promoting TJ assembly. In MDCK cells, attenuation of cellular N-glycosylation with siRNA to DPAGT1, the first gene in the N-glycosylation pathway, reduced N-glycosylation of surface E-cadherin and resulted in increased recruitment of stabilizing proteins gamma-catenin, alpha-catenin, vinculin and PP2A to AJs. Greater association of PP2A with AJs correlated with diminished binding of PP2A to ZO-1 and claudin-1 and with increased pools of serine-phosphorylated ZO-1 and claudin-1. More ZO-1 was found in complexes with occludin and claudin-1, and this corresponded to enhanced transepithelial resistance (TER), indicating physiological assembly of TJs. Similar maturation of AJs and TJs was detected after transfection of MDCK cells with the hypoglycosylated E-cadherin variant, V13. Our data indicate that E-cadherin N-glycans coordinate the maturity of AJs with the assembly of TJs by affecting the association of PP2A with these junctional complexes.


Figures

Fig. 1
Fig. 1
Silencing of DPAGT1 in MDCK cells. (A), Graph displaying the effects of different concentrations of DPAGT1 siRNA on DPAGT1 transcript levels (filled squares) and cell viability (filled triangles). Cy3-siRNA was used to determine transfection efficiency (open circles). Shown are means +/− S.E. from three independent experiments. (B), DPAGT1 protein levels following transfection with 60 nM siRNA. Total cell lysates (TCLs) from MDCK cells transfected with non-silencing (NS) and DPAGT1 (S) siRNAs were analyzed for DPAGT1 protein levels by Western blot (WB). Fold change of DPAGT1 abundance in silenced (S) cells was determined in comparison with non-silenced (NS) cells after normalization to actin. Data were obtained from three different experiments (**P<0.01). (C), TCLs from non-silenced (NS) and silenced (S) cells were examined for CNX expression by WB with an anti-CNX antibody. Fold change of CNX protein levels from silenced (S) cells was determined in comparison with non-silenced (NS) cells after normalization to actin using data from three independent experiments (**P<0.01). (D), TCLs from cells transiently transfected with either wild-type E-cadherin (E-cad-myc), V13 (V13-myc) or the empty plasmid (Mock) were analyzed for CNX expression by WB with an anti-CNX antibody. Fold changes of CNX protein levels from E-cad-myc- and V13-myc-transfected cells were determined in comparison with mock-transfected cells after normalization to actin using data from three different experiments.
Fig. 2
Fig. 2
Partial inhibition of DPAGT1 reduces N-glycosylation of surface E-cadherin in MDCK cells. (A), TCLs from non-silenced (NS) and silenced (S) cultures were treated with either EndoH (H) or PNGaseF (F) and analyzed using WB. Results depict one of three independent experiments (*P<0.02; **P<0.01). (B), Equal amounts of protein from non-silenced (NS) and silenced (S) cells were analyzed for E-cadherin expression by WB. Fold change of E-cadherin protein levels in silenced (S) cells was determined in comparison with non-silenced (NS) cells after normalization to actin in three independent experiments. (C), non-silenced (NS) and silenced (S) cells were biotinylated and equal amounts of biotin immunoprecipitates were analyzed for E-cadherin expression by WB. Fold change in biotinylated E-cadherin abundance from silenced (S) cells was determined in comparison with non-silenced (NS) cells using data from three independent experiments. (D), Biotinylated proteins from non-silenced (NS) and silenced (S) cells were treated with EndoH and PNGaseF and analyzed by WB. The results depict one of three independent experiments (*P<0.02; **P<0.01).
Fig. 3
Fig. 3
Partial silencing of DPAGT1 enhances AJs in MDCK cells. (A), Phase-contrast images of non-silenced (NS) and silenced (S) cells. Size bars, 25 µm. (B), Doubling times of non-silenced (NS) and silenced (S) cells. (**P<0.01). (C), TCLs from non-silenced (NS) and silenced (S) cells were examined for different catenins, vinculin and PP2A in comparison to actin by WB using data from four independent experiments. (D), Controls for immunoprecipitation experiments. TCLs were immunoprecipitated with antibodies against IgG isotypes and analyzed for expression of selected proteins by WB. (E), E-cadherins were immunoprecipitated from non-silenced (NS) and silenced (S) cells and analyzed for association with β-catenin, γ-catenin, α-catenin and vinculin by WB. Fold changes in protein levels associated with E-cadherin complexes from silenced (S) cells were determined in comparison to E-cadherin complexes from non-silenced (NS) cells after normalization to E-cadherin abundance with data from three independent experiments (**P<0.01). (F) E-cadherins were immunoprecipitated from TCL of non-silenced (NS) or silenced (S) cells, and their association with PP2A was assessed by WB. Fold change of PP2A protein levels from silenced (S) cells was determined in comparison with non-silenced (NS) cells after normalization to E-cadherin using data from three independent experiments (**P<0.01). (G) Non-silenced (NS) or silenced (S) cells were grown to confluence and processed for indirect immunofluorescence staining using an antibody to the cytoplasmic region of E-cadherin. Cells were counterstained for F-actin with rhodamine-phalloidin. Shown are 0.74 µm confocal x-y sections. Enhanced lateral colocalization of E-cadherin and F-actin in S cells compared to NS is highlighted in x–z sections. Size bars, 10 µm.
Fig. 4
Fig. 4
Hypoglycosylated E-cadherin enhances intercellular adhesion in MDCK cells. (A), Phase-contrast images of cells transfected with either wild type E-cadherin (E-cad-myc) or V13 (V13-myc). Size bars, 25 µm. (B), Doubling time of MDCK cells transfected with E-cad-myc and V13-myc. (**P<0.01). (C), Exogenous E-cadherins were immunoprecipitated from MDCK cells transfected with either wild type E-cadherin (E-cad-flag) or V13 (V13-flag) and examined for association with PP2A by WB. Fold change of PP2A protein level from V13-flag-transfected cells was determined in comparison with E-cad-flag-transfected cells after normalization to E-cadherin in three different experiments (**P<0.01). (D), Cells, transfected with E-cad-myc and V13-myc, were cultured in the presence of G418 to enrich for exogenous E-cadherins. Cells were immunostained for exogenous E-cadherins using an antibody to the myc tag, counterstained for F-actin with rhodamine phalloidin and examined by confocal microscopy. The images reflect 60% of cells expressing exogenous E-cadherin from a total population of 5×10⁵ cells. Shown are 0.74 µm thick confocal x-y sections. Size bars, 10 µm. The images represent one of three independent experiments.
Fig. 5
Fig. 5
Partial inhibition of DPAGT1 promotes the assembly of TJs in MDCK cells. (A), TCLs from non-silenced (NS) and silenced (S) cells were examined for ZO-1, occludin and claudin expression by WB and compared to actin using data from four independent experiments. (B), Controls for immunoprecipitation experiments. TCLs were immunoprecipitated with antibodies against IgG isotypes and analyzed for expression of selected proteins by WB. (C), ZO-1 was immunoprecipitated from non-silenced (NS) and silenced (S) cells and analyzed for association with E-cadherin by WB. Fold change in E-cadherin levels associated with ZO-1 complexes from silenced (S) cells was determined in comparison to non-silenced (NS) cells after normalization to ZO-1 abundance using data from three independent experiments (**P<0.01). (D), Reverse immunoprecipitation of E-cadherin in association with ZO-1. Fold change in ZO-1 levels associated with E-cadherin complexes from silenced (S) cells was determined in comparison to non-silenced (NS) cells after normalization to E-cadherin expression with data from three independent experiments (**P<0.01). (E), ZO-1 was immunoprecipitated from non-silenced (NS) or silenced (S) cells and examined for association with occludin, claudin-1 and PP2A by WB. Fold changes in the abundance of ZO-1-associated proteins from silenced (S) cells were determined in comparison with non-silenced (NS) cells after normalization to ZO-1 using data from three different experiments (**P<0.01). (F), Fold changes in ZO-1 Ser-phosphorylation levels from silenced (S) cells were determined in comparison to non-silenced (NS) cells after normalization to ZO-1 with data from three different experiments (**P<0.01). (G), Fold changes in the abundance of claudin-1-associated PP2A from silenced (S) cells were determined in comparison with non-silenced (NS) cells after normalization to claudin-1 using results from three different experiments (**P<0.01). (H), Fold changes in claudin-1 Ser-phosphorylation levels from silenced (S) cells were determined in comparison with non-silenced (NS) cells after normalization to claudin-1 with data from three different experiments (**P<0.01). (I), Immunofluorescence localization of ZO-1 and claudin-1 in non-silenced (NS) and silenced (S) cells. Shown are 0.74 µm thick confocal x-y sections. Size bars, 10 µm. Images represent one of three independent experiments. (J), Immunofluorescence localization of gp135 and ZO-1 in non-silenced (NS) and silenced (S) cells. Shown are 0.74 µm thick confocal x-y sections, with x–z sections at indicated x-y positions (green line). Size bars, 10 µm. Images represent one of three independent experiments. (K), TER measurements were carried out with confluent monolayers with duplicate samples for each siRNA. The value of TER for non-silenced (NS) cells was defined as 1.0. The results were obtained from three independent experiments (*P < 0.02).
Fig. 6
Fig. 6
Hypoglycosylated E-cadherin drives the assembly of TJs. (A), ZO-1 was immunoprecipitated from cells transfected with either wild type E-cadherin (E-cad-myc) or V13 (V13-myc), and examined for association with claudin-1 and PP2A by WB. Fold changes in claudin-1 and PP2A levels in complex with ZO-1 in V13-myc-transfected cells were determined in comparison with E-cad-myc-transfected cells after normalization to ZO-1, based on data from three different experiments (*P<0.02;**P<0.01). (B), Fold changes in ZO-1 Ser-phosphorylation levels from V13-myc transfected cells were determined in comparison with E-cad-myc cells after normalization to ZO-1, using data from three different experiments (**P<0.01). (C), Fold changes in PP2A levels in complex with claudin-1 in V13 transfectants were determined in comparison with E-cad transfectants after normalization toclaudin-1, based on data from three different experiments (**P<0.01). (D), Fold changes in claudin-1 Ser-phosphorylation levels from V13-myc transfected cells were determined in comparison with E-cad-myc transfected cells after normalization to claudin-1 with data from three different experiments (**P<0.01). (E), Immunofluorescence localization of ZO-1 and claudin-1. Shown are 0.74 µm thick confocal x-y sections. Size bars, 10 µm. Images represent one of three independent experiments. (F), Immunofluorescence localization of gp135 and ZO-1 in E-cad and V13 transfectants. Shown are 0.74 µm thick confocal x-y sections, with x–z sections at indicated x-y positions (green line). Size bars, 10 µm. Images represent one of three independent experiments. (G), TER was measured in confluent monolayers of E-cad-myc and V13-myc transfected cells, with the value for TER from E-cad-myc cells defined as 1. Data were obtained using duplicate samples from four different experiments (*P < 0.02).
Fig. 7
Fig. 7
Schematic representation of how downregulation of E-cadherin N-glycosylation drives intercellular adhesion through PP2A. E-cadherin N-glycans interfere with the recruitment of PP2A to AJs, thus facilitating the association of PP2A with ZO-1 and claudin-1 (dashed brackets). Partial inhibition of E-cadherin N-glycosylation, via either siRNA to DPAGT1 or through the deletion of E-cadherin’s two major N-glycan addition sites, stabilizes AJs and enhances their interaction with PP2A (bold brackets). This relieves PP2A-mediated inhibition of ZO-1 and claudin-1 phosphorylation, promotes redistribution of ZO-1 to the sites of TJs and drives TJ assembly.

Similar articles

Cited by

References

    1. Hirano S, Nose A, Hatta K, Kawakami A, Takeichi M. Calcium-dependent cell-cell adhesion molecules (cadherins): specificities and possible involvement of actin bundles. J. Cell Biol. 1987;105:2501–2511. - PMC - PubMed
    1. Jamora C, Fuchs E. Intercellular adhesion, signalling and the cytoskeleton. Nat. Cell Biol. 2002;4:101–108. - PubMed
    1. Larue L, Ohsugi M, Hirchenhain J, Kemler R. E-cadherin null mutant embryos fail to form a trophectoderm epithelium. Proc. Natl. Acad. Sci. USA. 1994;91:8263–8267. - PMC - PubMed
    1. Gumbiner BM. Cell adhesion: the molecular basis of tissue architercture and morphogenesis. Cell. 1996;84:345–357. - PubMed
    1. Gumbiner B, Stevenson B, Grimaldi A. The role of the cell adhesion molecule uvomorulin in the formation and maintenance of the epithelial junctional complex. J. Cell Biol. 1988;107:1575–1587. - PMC - PubMed

Publication types

MeSH terms