

Differential ion mobility spectroscopy: non-invasive real-time diagnostics and therapy control in metabolic diseases
- PMID: 20156741
- PMCID: PMC3521328
- DOI: 10.1186/2047-783x-14-s4-121
Differential ion mobility spectroscopy: non-invasive real-time diagnostics and therapy control in metabolic diseases
Abstract
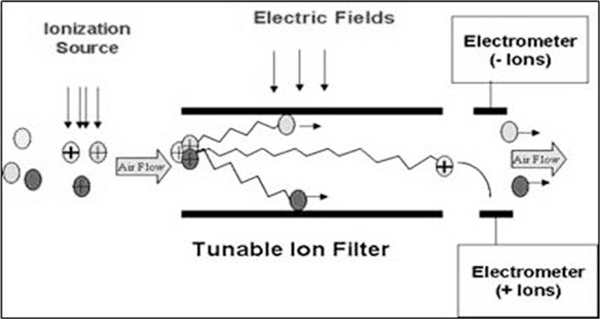
Background: Over the last few years, differential ion mobility spectroscopy (DMS) has become an important tool in medical research. There are attempts to find markers for specific diseases in exhaled air, using this technology as a non-invasive early diagnosis.
Objective: In the present research, exhaled air from 78 patients with known diagnosis and 39 control persons were tested with a DMS system from Sionex.
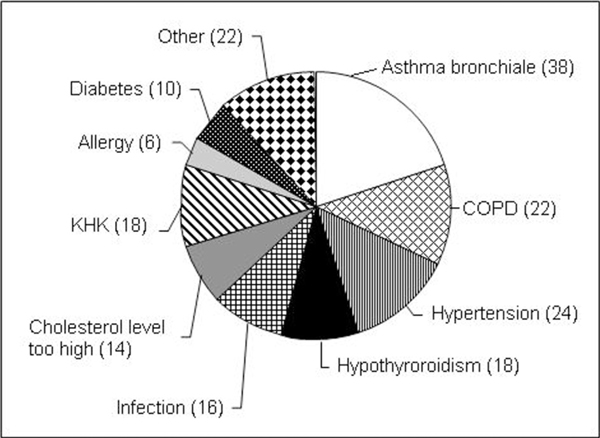
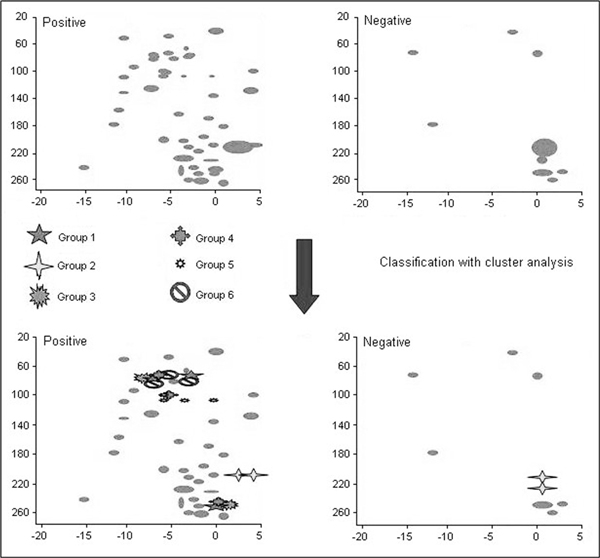
Results: Bronchial asthma showed a pattern of 6 characteristic points in a discriminant analysis. Patients with diagnosed hypertension showed a characteristic pattern with 4 points, hypothyroidism 2 points; increased LDL cholesterol 3 points, and type II diabetics treated with insulin 4 spots. No significant differences with respect to the control group were found in chronic obstructive pulmonary disease patients. The DMS pattern in the tested asthmatics showed a partial change depending on different medications used.
Conclusion: Differential ion mobility spectroscopy offers promise as a helpful diagnostic tool.
Figures
References
-
- Amann A, Smith D. Breath Analysis for clinical diagnosis and therapeutic monitoring. World Scientific. 2005. Singapore. - PubMed
MeSH terms
LinkOut - more resources
Full Text Sources
Other Literature Sources
Medical