

Control of starch branching in barley defined through differential RNAi suppression of starch branching enzyme IIa and IIb
- PMID: 20156842
- PMCID: PMC2837261
- DOI: 10.1093/jxb/erq011
Control of starch branching in barley defined through differential RNAi suppression of starch branching enzyme IIa and IIb
Abstract
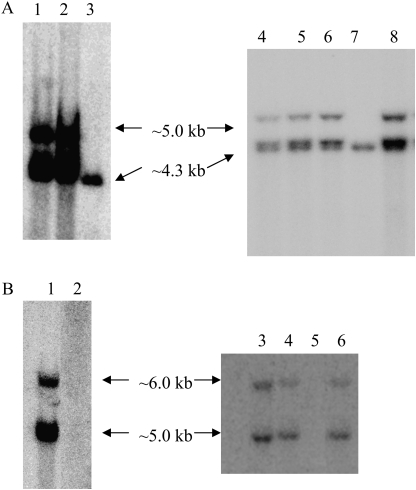
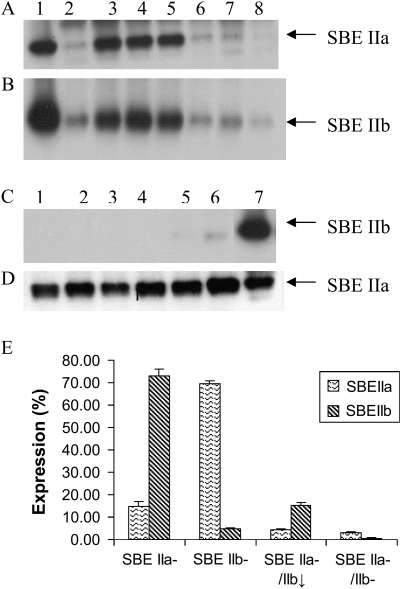
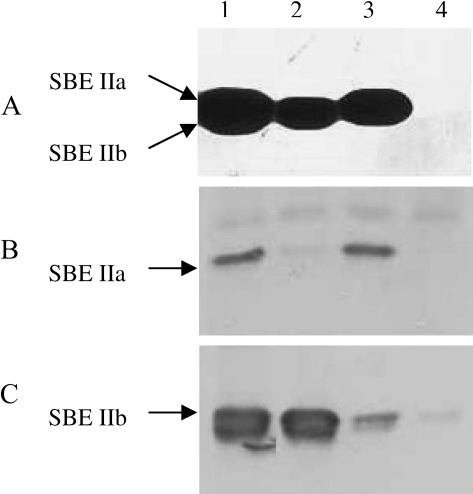
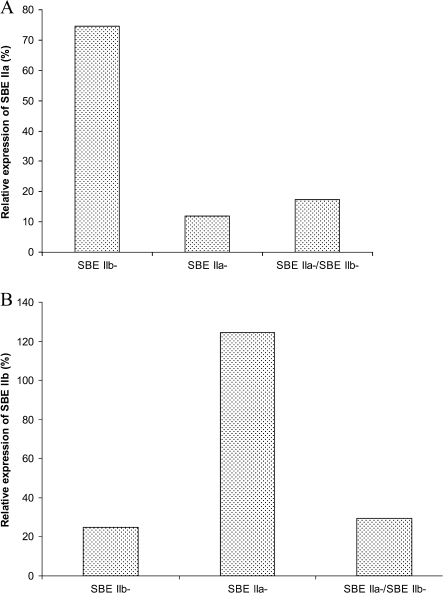
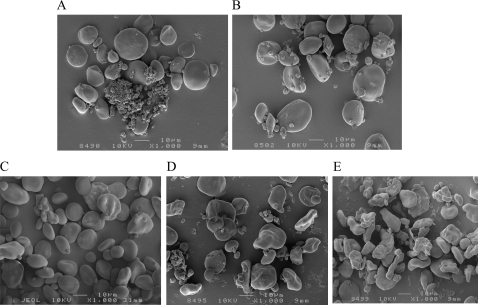
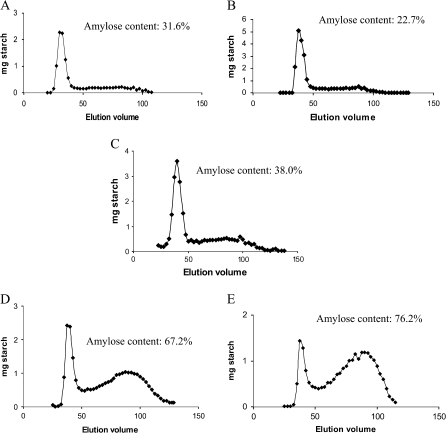
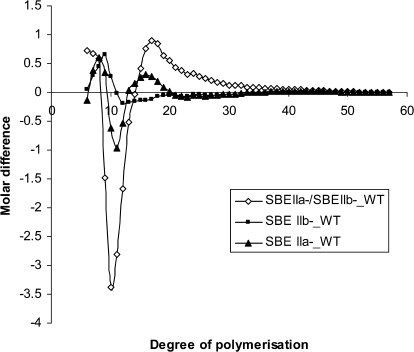
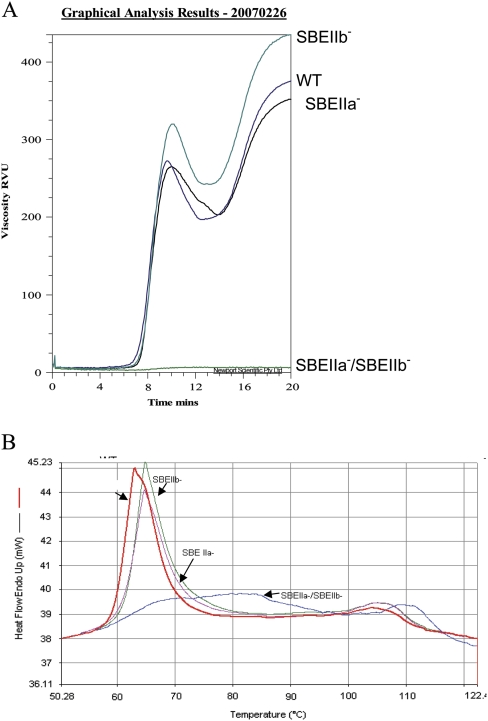
The roles of starch branching enzyme (SBE, EC 2.4.1.18) IIa and SBE IIb in defining the structure of amylose and amylopectin in barley (Hordeum vulgare) endosperm were examined. Barley lines with low expression of SBE IIa or SBE IIb, and with the low expression of both isoforms were generated through RNA-mediated silencing technology. These lines enabled the study of the role of each of these isoforms in determining the amylose content, the distribution of chain lengths, and the frequency of branching in both amylose and amylopectin. In lines where both SBE IIa and SBE IIb expression were reduced by >80%, a high amylose phenotype (>70%) was observed, while a reduction in the expression of either of these isoforms alone had minor impact on amylose content. The structure and properties of the high amylose starch resulting from the concomitant reduction in the expression of both isoforms of SBE II in barley were found to approximate changes seen in amylose extender mutants of maize, which result from lesions eliminating expression of the SBE IIb gene. Amylopectin chain length distribution analysis indicated that both SBE IIa and SBE IIb isoforms play distinct roles in determining the fine structure of amylopectin. A significant reduction in the frequency of branches in amylopectin was noticed only when both SBE IIa and SBE IIb were reduced, whereas there was a significant increase in the branching frequency of amylose when SBE IIb alone was reduced. Functional interactions between SBE isoforms are suggested, and a possible inhibitory role of SBE IIb on other SBE isoforms is discussed.
Figures
Similar articles
-
Concerted suppression of all starch branching enzyme genes in barley produces amylose-only starch granules.BMC Plant Biol. 2012 Nov 21;12:223. doi: 10.1186/1471-2229-12-223. BMC Plant Biol. 2012. PMID: 23171412 Free PMC article.
-
Reduced expression of starch branching enzyme IIa and IIb in maize endosperm by RNAi constructs greatly increases the amylose content in kernel with nearly normal morphology.Planta. 2015 Feb;241(2):449-61. doi: 10.1007/s00425-014-2192-1. Epub 2014 Nov 5. Planta. 2015. PMID: 25366555
-
The different effects of starch synthase IIa mutations or variation on endosperm amylose content of barley, wheat and rice are determined by the distribution of starch synthase I and starch branching enzyme IIb between the starch granule and amyloplast stroma.Theor Appl Genet. 2015 Jul;128(7):1407-19. doi: 10.1007/s00122-015-2515-z. Epub 2015 Apr 19. Theor Appl Genet. 2015. PMID: 25893467
-
Progress in controlling starch structure by modifying starch-branching enzymes.Planta. 2016 Jan;243(1):13-22. doi: 10.1007/s00425-015-2421-2. Planta. 2016. PMID: 26486516 Review.
-
A review of starch-branching enzymes and their role in amylopectin biosynthesis.IUBMB Life. 2014 Aug;66(8):546-58. doi: 10.1002/iub.1297. Epub 2014 Sep 5. IUBMB Life. 2014. PMID: 25196474 Review.
Cited by
-
Starch biosynthesis in cereal endosperms: An updated review over the last decade.Plant Commun. 2021 Sep 2;2(5):100237. doi: 10.1016/j.xplc.2021.100237. eCollection 2021 Sep 13. Plant Commun. 2021. PMID: 34746765 Free PMC article. Review.
-
Combining mutations at genes encoding key enzymes involved in starch synthesis affects the amylose content, carbohydrate allocation and hardness in the wheat grain.Plant Biotechnol J. 2018 Oct;16(10):1723-1734. doi: 10.1111/pbi.12908. Epub 2018 Apr 17. Plant Biotechnol J. 2018. PMID: 29499105 Free PMC article.
-
Advances in RNA Interference for Plant Functional Genomics: Unveiling Traits, Mechanisms, and Future Directions.Appl Biochem Biotechnol. 2024 Sep;196(9):5681-5710. doi: 10.1007/s12010-023-04850-x. Epub 2024 Jan 4. Appl Biochem Biotechnol. 2024. PMID: 38175411 Review.
-
Development of high amylose wheat through TILLING.BMC Plant Biol. 2012 May 14;12:69. doi: 10.1186/1471-2229-12-69. BMC Plant Biol. 2012. PMID: 22584013 Free PMC article.
-
Concerted suppression of all starch branching enzyme genes in barley produces amylose-only starch granules.BMC Plant Biol. 2012 Nov 21;12:223. doi: 10.1186/1471-2229-12-223. BMC Plant Biol. 2012. PMID: 23171412 Free PMC article.
References
-
- Ball SG, Morell MK. From bacterial glycogen to starch: understanding the biogenesis of the plant starch granule. Annual Review of Plant Biology. 2003;54:207–233. - PubMed
-
- Bernfeld P. Amylases, α and β. Methods in Enzymology. 1955;1:149–158.
-
- Bhattacharyya MK, Martin C, Smith A. The importance of starch biosynthesis in the wrinkled seed shape character of peas studied by Mendel. Plant Molecular Biology. 1993;22:525–531. - PubMed
-
- Blauth SL, Kim KN, Klucinec J, Shannon JC, Thompson DB, Guiltinan M. Identification of Mutator insertional mutants of starch-branching enzyme 1 (SBE1) in Zea mays L. Plant Molecular Biology. 2002;48:287–297. - PubMed
MeSH terms
Substances
LinkOut - more resources
Full Text Sources
Other Literature Sources
