. 2010 Feb 22;188(4):515-26.
doi: 10.1083/jcb.200911115. Epub 2010 Feb 15.

Signal sequence insufficiency contributes to neurodegeneration caused by transmembrane prion protein

Affiliations

Signal sequence insufficiency contributes to neurodegeneration caused by transmembrane prion protein

Neena S Rane et al. J Cell Biol. .

Abstract

Protein translocation into the endoplasmic reticulum is mediated by signal sequences that vary widely in primary structure. In vitro studies suggest that such signal sequence variations may correspond to subtly different functional properties. Whether comparable functional differences exist in vivo and are of sufficient magnitude to impact organism physiology is unknown. Here, we investigate this issue by analyzing in transgenic mice the impact of signal sequence efficiency for mammalian prion protein (PrP). We find that replacement of the average efficiency signal sequence of PrP with more efficient signals rescues mice from neurodegeneration caused by otherwise pathogenic PrP mutants in a downstream hydrophobic domain (HD). This effect is explained by the demonstration that efficient signal sequence function precludes generation of a cytosolically exposed, disease-causing transmembrane form of PrP mediated by the HD mutants. Thus, signal sequences are functionally nonequivalent in vivo, with intrinsic inefficiency of the native PrP signal being required for pathogenesis of a subset of disease-causing PrP mutations.


Figures
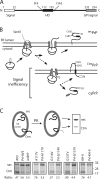
Figure 1.
Figure 1.
Improving signal efficiency reduces CtmPrP in vitro. (A) Line diagram of PrP showing elements involved in its translocation. Amino acid residues of key domains, and the epitopes for the 3F4 and 13A5 monoclonal antibodies, are indicated. (B) Steps in PrP translocation. Starting at the left, PrP is targeted to a Sec61 translocon via its N-terminal signal sequence. The signal then interacts with Sec61 and gates open the channel to initiate translocation. Further protein synthesis results in complete translocation into the ER lumen to generate secPrP. This is the normal pathway followed by the majority of PrP polypeptides synthesized. However, intrinsic inefficiencies in the signal sequence interaction with the translocon can cause a small proportion of PrP polypeptides to fail at the crucial gating/initiation steps. The bottom shows the two potential outcomes when signal-mediated gating and/or early translocation fails. In the first case, the polypeptide is expelled into the cytosol to generate cyPrP. Alternatively, the central HD, particularly if it carries a mutation that increases hydrophobicity, can engage the nearby translocon to generate CtmPrP. (C) Analysis of translocation and topology of various PrP constructs in vitro. The indicated constructs were translated in reticulocyte lysate containing rough microsomes. The samples were then digested with PK and analyzed by SDS-PAGE and autoradiography. The diagram illustrates the assay whereby secPrP is fully protected from PK digestion, whereas CtmPrP is partially digested to generate an 18-kD fragment. The ratio of the secPrP to CtmPrP products for each construct is shown below the individual lanes. Note that each of the mutations increases CtmPrP (i.e., reduced sec/Ctm ratio) but is largely reverted when the signal sequence from Prl is used. Numbers to the right indicate molecular mass in kD.
Figure 2.
Figure 2.
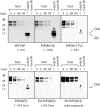
Analysis of PrP translocation and CtmPrP in cultured cells. Limited PK digestion assay for CtmPrP in crude microsomes isolated from N2a cells transfected with the indicated constructs. Samples were subjected to PK digestion under either mild or harsh conditions (as described in Materials and methods). The protease-digested samples were deglycosylated with peptide-N-glycosidase F and analyzed by immunoblotting alongside serial dilutions of untreated samples (first four lanes of each panel). The relative amounts loaded in each lane are indicated above the gels. Blots were probed with monoclonal antibodies 13A5 (wild-type [WT] and KH-II panels) or 3F4 (other panels). The CtmPrP-specific fragment (arrows) and C-terminal GD fragment (recognized only by the 13A5 antibody) are indicated. The percentage of total PrP in the CtmPrP form was quantified and indicated below each panel. Numbers on the left indicate molecular mass in kD.
Figure 3.
Figure 3.
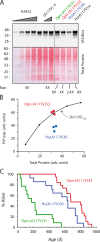
Rescue from a disease-causing HD mutant by improving signal efficiency. (A) Brain homogenates from three individual mice from each of the three Prl-PrP(AV3) transgenic lines were compared with serial dilutions of homogenate from PrP(A117V)H mice, which served as a standard. After SDS-PAGE, the upper portion of the gel was stained with colloidal coomassie blue, whereas the lower portion was immunoblotted using 3F4 antibody. (B) Quantification of two experiments, as in A, showing the PrP(A117V)H standards (black circles) and each transgenic line (mean ± SD; n = 6). Using an expression level of 4× for PrP(A117V)H, the expression for lines 6, 10, and 11 were determined to be 2.4×, 4.7×, and 5.7×, respectively. (C) Expression levels of Prl-PrP(AV3) lines were compared with previously characterized mouse lines known to produce CtmPrP and develop neurodegeneration (Hegde et al., 1998a, 1999). The A3922 transgenic line, which expresses at 4×, served as a standard. Two amounts of each sample were loaded, and the blots were first stained for total protein with Ponceau S before immunoblotting with 13A5 antibody. The samples were run on two gels, with one set of samples (from PrP[KH-II]H) duplicated on each gel to ensure that they were directly comparable. Below the lanes are the quantified expression levels and mean age of neurodegeneration taken from either this or earlier studies. “n/a” indicates that disease is not observed in these lines. The vertical black line indicates that intervening lanes have been spliced out. (D) Kaplan-Meier survival plots for the indicated transgenic mouse lines. The normal lifespan of this strain of mouse in our facility is ∼600–800 d. The broken line indicates the age at which PrP(AV3) founders were observed to develop signs of disease (Hegde et al., 1998a). Numbers to the left of the blots in A and C indicate molecular mass in kD.
Figure 4.
Figure 4.
Increased signal efficiency reduces CtmPrP levels in transgenic mice. (A) Mouse brain homogenates from the indicated transgenic mice were subjected to limited PK digestion under “mild” conditions (see Materials and methods) and PrP detected by immunoblotting (two exposures, as well as total protein staining of the blot, are shown). The diagnostic CtmPrP-specific fragment and C-terminal GD that resists digestion under these conditions are indicated. The relative amounts of each sample loaded on the gel are indicated above the lanes. No signal was seen on the blot of samples digested under “harsh” conditions (not depicted). (B) Direct comparison of CtmPrP levels in three Prl-PrP(AV3) line 11 animals relative to PrP(A117V)H. Quantification showed ∼1.3× higher CtmPrP in Prl-PrP(AV3)11. A3922 expresses wild-type PrP at 4×, and serves as a negative control. It contains very low, but detectable, levels of CtmPrP. Numbers to the sides of the blots indicate molecular mass in kD.
Figure 5.
Figure 5.
Effect of improving signal efficiency on a human disease-causing HD mutant. (A) Analysis of expression levels for the indicated transgenic mice using serial dilutions of the A3922 mouse as a standard. The blot was first stained for total protein with Ponceau S, followed by immunodetection with 3F4. All samples were analyzed on the same gel and are shown from the same exposure. The black vertical line indicates the position where an irrelevant lane was spliced out of the image. Numbers to the left indicate molecular mass in kD. (B) Quantification of expression levels in the indicated transgenic lines relative to PrP(A117V)H standards. Individual data points are shown. From this experiment, we calculated that HuPrP(A117V)36 expresses at 2.4 ± 0.3×, whereas Opn-HuPrP(A117V)33 expresses at 4 ± 0.2×. (C) Kaplan-Meier survival plots for the indicated transgenic mouse lines. The data for HuPrP(A117V)36 was compared with Opn-HuPrP(A117V)33 using the log-rank test and found to be statistically different (P = 0.02).
Figure 6.
Figure 6.
Phenotypic rescue in transgenic mice upon improving signal efficiency. (A) The smaller size of HuPrP(A117V)36 mice often seen at older ages (which is indicative of some wasting) is not seen for Opn-HuPrP(A117V)33. Some HuPrP(A117V)36 mice also show kyphosis (hunched posture; arrow). (B) The rough hair coat in HuPrP(A117V)36 mice, often an indicator of reduced grooming activity, is not seen in Opn-HuPrP(A117V)33. (C) Evidence of hind limb weakness in HuPrP(A117V)36 mice, but not in Opn-HuPrP(A117V)33. The top two images in each panel show successive steps during normal walking. The bottom images show side views. Note that the HuPrP(A117V)36 mouse is lower to the ground and the tail drags. In contrast, the Opn-HuPrP(A117V)33 mouse keeps its posterior and tail elevated during walking. (D) Staining of brain sections from 2-yr-old HuPrP(A117V)36 and Opn-HuPrP(A117V)33 mice for astrogliosis using anti-GFAP antibody. A region of the hippocampus is shown. Bars, 50 µm.

Similar articles

Cited by

References

    1. Anandatheerthavarada H.K., Biswas G., Robin M.A., Avadhani N.G. 2003. Mitochondrial targeting and a novel transmembrane arrest of Alzheimer’s amyloid precursor protein impairs mitochondrial function in neuronal cells. J. Cell Biol. 161:41–54 10.1083/jcb.200207030 - DOI - PMC - PubMed
    1. Belin D., Bost S., Vassalli J.D., Strub K. 1996. A two-step recognition of signal sequences determines the translocation efficiency of proteins. EMBO J. 15:468–478 - PMC - PubMed
    1. Besemer J., Harant H., Wang S., Oberhauser B., Marquardt K., Foster C.A., Schreiner E.P., de Vries J.E., Dascher-Nadel C., Lindley I.J. 2005. Selective inhibition of cotranslational translocation of vascular cell adhesion molecule 1. Nature. 436:290–293 10.1038/nature03670 - DOI - PubMed
    1. Chakrabarti O., Hegde R.S. 2009. Functional depletion of mahogunin by cytosolically exposed prion protein contributes to neurodegeneration. Cell. 137:1136–1147 10.1016/j.cell.2009.03.042 - DOI - PMC - PubMed
    1. Chakrabarti O., Ashok A., Hegde R.S. 2009. Prion protein biosynthesis and its emerging role in neurodegeneration. Trends Biochem. Sci. 34:287–295 10.1016/j.tibs.2009.03.001 - DOI - PMC - PubMed

Publication types