

ADAM10 is essential for Notch2-dependent marginal zone B cell development and CD23 cleavage in vivo
- PMID: 20156974
- PMCID: PMC2839139
- DOI: 10.1084/jem.20091990
ADAM10 is essential for Notch2-dependent marginal zone B cell development and CD23 cleavage in vivo
Abstract
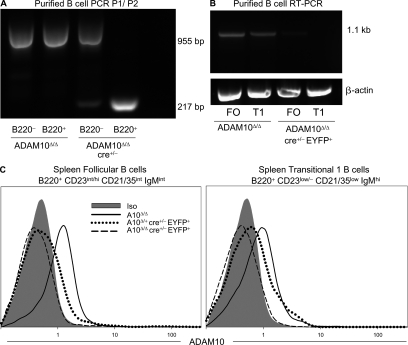
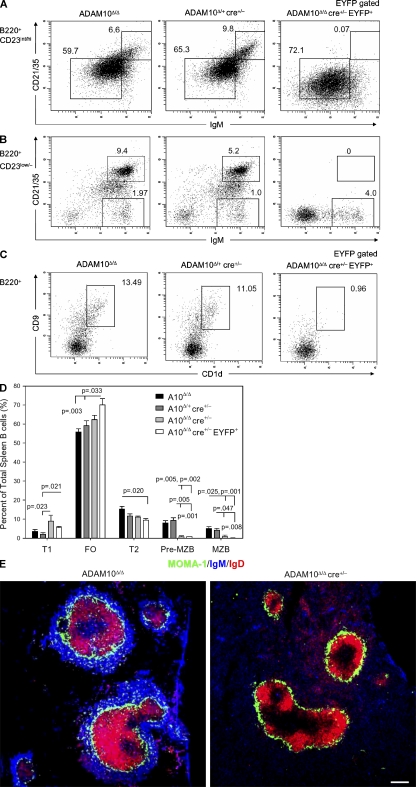
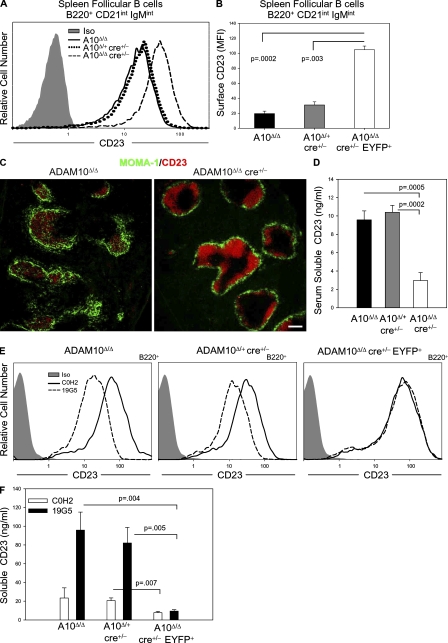
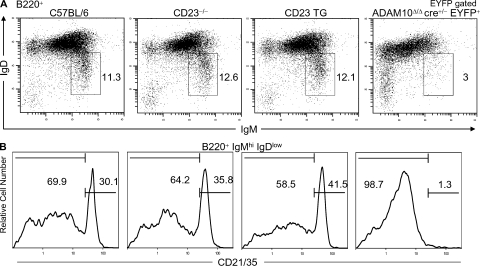
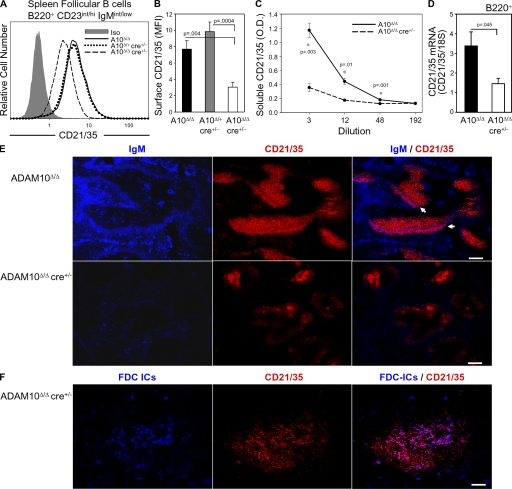
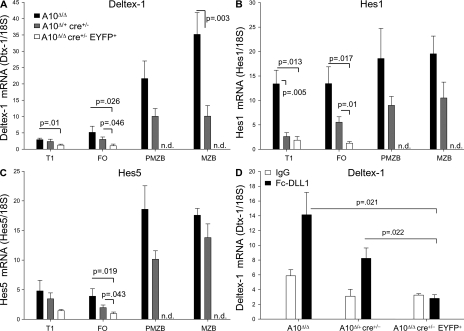
The proteolytic activity of a disintegrin and metalloproteinase 10 (ADAM10) regulates cell-fate decisions in Drosophila and mouse embryos. However, in utero lethality of ADAM10(-/-) mice has prevented examination of ADAM10 cleavage events in lymphocytes. To investigate their role in B cell development, we generated B cell-specific ADAM10 knockout mice. Intriguingly, deletion of ADAM10 prevented development of the entire marginal zone B cell (MZB) lineage. Additionally, cleavage of the low affinity IgE receptor, CD23, was profoundly impaired, but subsequent experiments demonstrated that ADAM10 regulates CD23 cleavage and MZB development by independent mechanisms. Development of MZBs is dependent on Notch2 signaling, which requires proteolysis of the Notch2 receptor by a previously unidentified proteinase. Further experiments revealed that Notch2 signaling is severely impaired in ADAM10-null B cells. Thus, ADAM10 critically regulates MZB development by initiating Notch2 signaling. This study identifies ADAM10 as the in vivo CD23 sheddase and an important regulator of B cell development. Moreover, it has important implications for the treatment of numerous CD23- and Notch-mediated pathologies, ranging from allergy to cancer.
Figures
Similar articles
-
CD23 Sheddase A disintegrin and metalloproteinase 10 (ADAM10) is also required for CD23 sorting into B cell-derived exosomes.J Biol Chem. 2010 Nov 26;285(48):37531-41. doi: 10.1074/jbc.M110.141556. Epub 2010 Sep 28. J Biol Chem. 2010. PMID: 20876574 Free PMC article.
-
The low affinity IgE receptor (CD23) is cleaved by the metalloproteinase ADAM10.J Biol Chem. 2007 May 18;282(20):14836-44. doi: 10.1074/jbc.M608414200. Epub 2007 Mar 27. J Biol Chem. 2007. PMID: 17389606 Free PMC article.
-
Adrenergic regulation of IgE involves modulation of CD23 and ADAM10 expression on exosomes.J Immunol. 2013 Dec 1;191(11):5383-97. doi: 10.4049/jimmunol.1301019. Epub 2013 Oct 18. J Immunol. 2013. PMID: 24140643 Free PMC article.
-
The emergence of ADAM10 as a regulator of lymphocyte development and autoimmunity.Mol Immunol. 2011 Jun;48(11):1319-27. doi: 10.1016/j.molimm.2010.12.005. Epub 2011 Jan 13. Mol Immunol. 2011. PMID: 21236490 Free PMC article. Review.
-
Part-time alpha-secretases: the functional biology of ADAM 9, 10 and 17.Curr Alzheimer Res. 2008 Apr;5(2):187-201. doi: 10.2174/156720508783954686. Curr Alzheimer Res. 2008. PMID: 18393804 Review.
Cited by
-
Increased B Cell ADAM10 in Allergic Patients and Th2 Prone Mice.PLoS One. 2015 May 1;10(5):e0124331. doi: 10.1371/journal.pone.0124331. eCollection 2015. PLoS One. 2015. PMID: 25933166 Free PMC article.
-
Soluble T cell immunoglobulin mucin domain 3 is shed from CD8+ T cells by the sheddase ADAM10, is increased in plasma during untreated HIV infection, and correlates with HIV disease progression.J Virol. 2015 Apr;89(7):3723-36. doi: 10.1128/JVI.00006-15. Epub 2015 Jan 21. J Virol. 2015. PMID: 25609823 Free PMC article.
-
Intriguing Roles for Endothelial ADAM10/Notch Signaling in the Development of Organ-Specific Vascular Beds.Physiol Rev. 2018 Oct 1;98(4):2025-2061. doi: 10.1152/physrev.00029.2017. Physiol Rev. 2018. PMID: 30067156 Free PMC article. Review.
-
EGF promotes the shedding of soluble E-cadherin in an ADAM10-dependent manner in prostate epithelial cells.Cell Signal. 2012 Feb;24(2):532-538. doi: 10.1016/j.cellsig.2011.10.004. Epub 2011 Oct 14. Cell Signal. 2012. PMID: 22024284 Free PMC article.
-
The follicular dendritic cell network in secondary follicles of human palatine tonsils and spleens.Histochem Cell Biol. 2011 Apr;135(4):327-36. doi: 10.1007/s00418-011-0799-x. Epub 2011 Mar 11. Histochem Cell Biol. 2011. PMID: 21394653
References
Publication types
MeSH terms
Substances
Grants and funding
LinkOut - more resources
Full Text Sources
Other Literature Sources
Molecular Biology Databases
Miscellaneous
