

A novel nucleoid protein of Escherichia coli induced under anaerobiotic growth conditions
- PMID: 20156994
- PMCID: PMC2887951
- DOI: 10.1093/nar/gkq077
A novel nucleoid protein of Escherichia coli induced under anaerobiotic growth conditions
Abstract
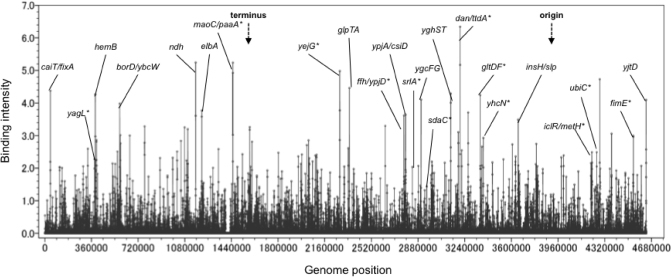
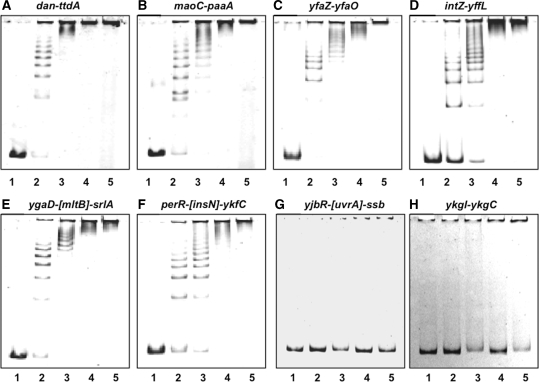
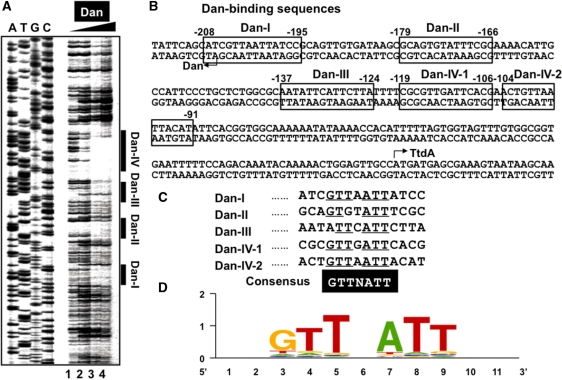
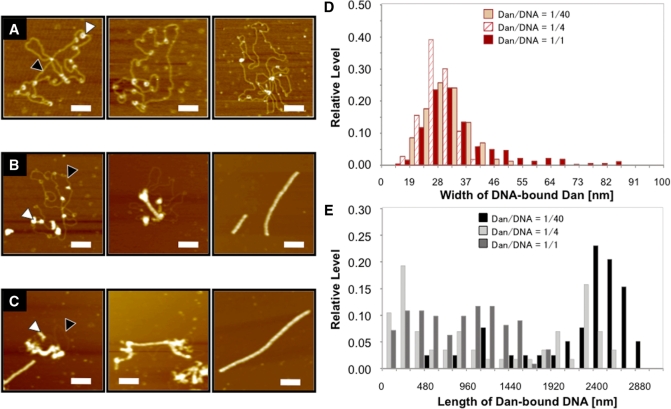
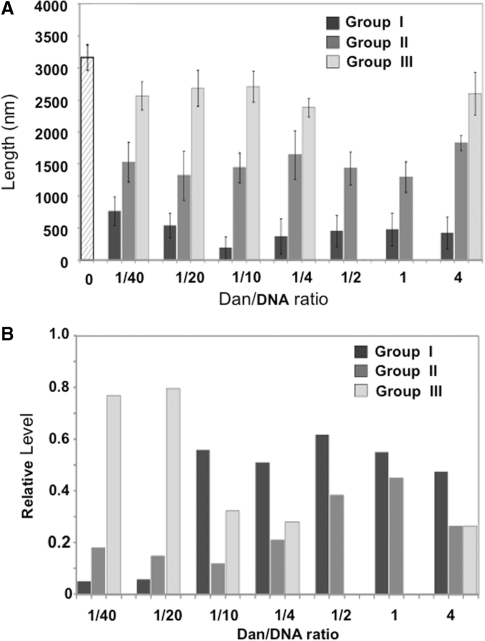
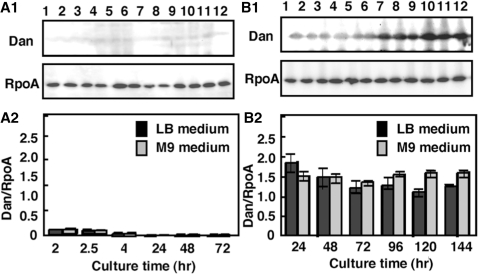
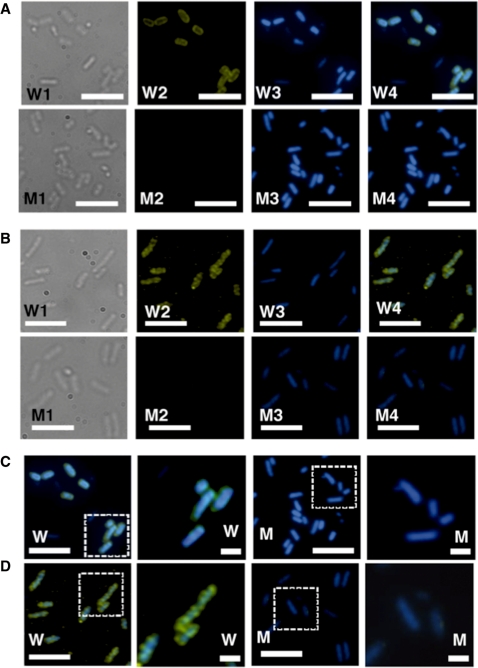
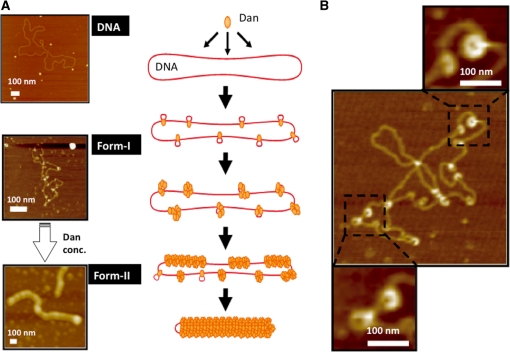
A systematic search was performed for DNA-binding sequences of YgiP, an uncharacterized transcription factor of Escherichia coli, by using the Genomic SELEX. A total of 688 YgiP-binding loci were identified after genome-wide profiling of SELEX fragments with a high-density microarray (SELEX-chip). Gel shift and DNase-I footprinting assays indicated that YgiP binds to multiple sites along DNA probes with a consensus GTTNATT sequence. Atomic force microscope observation indicated that at low concentrations, YgiP associates at various sites on DNA probes, but at high concentrations, YgiP covers the entire DNA surface supposedly through protein-protein contact. The intracellular concentration of YgiP is very low in growing E. coli cells under aerobic conditions, but increases more than 100-fold to the level as high as the major nucleoid proteins under anaerobic conditions. An E. coli mutant lacking ygiP showed retarded growth under anaerobic conditions. High abundance and large number of binding sites together indicate that YgiP is a nucleoid-associated protein with both architectural and regulatory roles as the nucleoid proteins Fis and IHF. We then propose that YgiP is a novel nucleoid protein of E. coli under anaerobiosis and propose to rename it Dan (DNA-binding protein under anaerobic conditions).
Figures
Similar articles
-
Atomic force microscopy analysis of the role of major DNA-binding proteins in organization of the nucleoid in Escherichia coli.PLoS One. 2013 Aug 12;8(8):e72954. doi: 10.1371/journal.pone.0072954. eCollection 2013. PLoS One. 2013. PMID: 23951337 Free PMC article.
-
A novel regulator RcdA of the csgD gene encoding the master regulator of biofilm formation in Escherichia coli.Microbiologyopen. 2012 Dec;1(4):381-94. doi: 10.1002/mbo3.42. Epub 2012 Oct 8. Microbiologyopen. 2012. PMID: 23233451 Free PMC article.
-
Genomic SELEX search for target promoters under the control of the PhoQP-RstBA signal relay cascade.J Bacteriol. 2007 Jul;189(13):4791-9. doi: 10.1128/JB.00319-07. Epub 2007 Apr 27. J Bacteriol. 2007. PMID: 17468243 Free PMC article.
-
Pervasive regulation of nucleoid structure and function by nucleoid-associated proteins.Curr Opin Microbiol. 2011 Apr;14(2):136-41. doi: 10.1016/j.mib.2011.01.003. Epub 2011 Jan 31. Curr Opin Microbiol. 2011. PMID: 21288763 Review.
-
Structure and function of bacterial H-NS protein.Biochem Soc Trans. 2016 Dec 15;44(6):1561-1569. doi: 10.1042/BST20160190. Biochem Soc Trans. 2016. PMID: 27913665 Review.
Cited by
-
Identification of the set of genes, including nonannotated morA, under the direct control of ModE in Escherichia coli.J Bacteriol. 2013 Oct;195(19):4496-505. doi: 10.1128/JB.00304-13. Epub 2013 Aug 2. J Bacteriol. 2013. PMID: 23913318 Free PMC article.
-
The whole set of constitutive promoters recognized by RNA polymerase RpoD holoenzyme of Escherichia coli.PLoS One. 2014 Mar 6;9(3):e90447. doi: 10.1371/journal.pone.0090447. eCollection 2014. PLoS One. 2014. PMID: 24603758 Free PMC article.
-
Transcription profile of Escherichia coli: genomic SELEX search for regulatory targets of transcription factors.Nucleic Acids Res. 2016 Mar 18;44(5):2058-74. doi: 10.1093/nar/gkw051. Epub 2016 Feb 3. Nucleic Acids Res. 2016. PMID: 26843427 Free PMC article.
-
The nucleoid-associated protein Dan organizes chromosomal DNA through rigid nucleoprotein filament formation in E. coli during anoxia.Nucleic Acids Res. 2013 Jan;41(2):746-53. doi: 10.1093/nar/gks1126. Epub 2012 Nov 23. Nucleic Acids Res. 2013. PMID: 23180762 Free PMC article.
-
Regulation of Bacterial DNA Packaging in Early Stationary Phase by Competitive DNA Binding of Dps and IHF.Sci Rep. 2015 Dec 14;5:18146. doi: 10.1038/srep18146. Sci Rep. 2015. PMID: 26657062 Free PMC article.
References
-
- Bachmann B. Derivations and genotypes of some mutant derivatives of Escherichia coli K-12. In: Neidhardt FC, et al., editors. Escherichia coli and Salmnella. Washington: ASM Press; 1996. pp. 2460–2488.
-
- Ishihama A. Functional modulation of Escherichia coli RNA polymerase. Ann. Rev. Microbiol. 2000;54:499–518. - PubMed
-
- Ishihama A. The nucleoid: an overview. In: Neidhardt FC, et al., editors. Escherichia coli and Salmnella, 2nd version. Washington: ASM Press; 2009.
Publication types
MeSH terms
Substances
LinkOut - more resources
Full Text Sources
Molecular Biology Databases
Research Materials
Miscellaneous
