Coordinate down-regulation of adenylyl cyclase isoforms and the stimulatory G protein (G(s)) in intestinal epithelial cell differentiation
- PMID: 20157112
- PMCID: PMC2857080
- DOI: 10.1074/jbc.M109.059741
Coordinate down-regulation of adenylyl cyclase isoforms and the stimulatory G protein (G(s)) in intestinal epithelial cell differentiation
Abstract
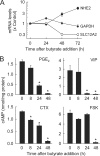
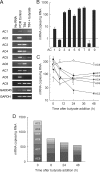
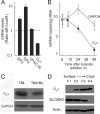
The intestinal epithelium is dynamic, with proliferation of undifferentiated crypt cells balanced by terminal differentiation and cell death at the colon surface or small intestinal villus tips. Cyclic AMP, induced by agonists such as prostaglandin E(2) and vasoactive intestinal polypeptide, promotes proliferation and ion secretion and suppresses apoptosis in intestinal epithelial cells. Here, we show that cell differentiation in a model intestinal epithelium leads to attenuation of cAMP production in response to G protein-coupled receptor and receptor-independent agonists. Concomitantly, key components of the cAMP cascade, the alpha subunit of the stimulatory G protein, G(s), and adenylyl cyclase (AC) isoforms 3, 4, 6, and 7 are down-regulated. By contrast, AC1, AC2, AC8, and AC9, and the receptors for prostaglandin E(2) and vasoactive intestinal polypeptide, are not expressed or not affected by differentiation. We confirmed key findings in normal murine colon epithelium, in which the major AC isoforms and G(s)alpha are markedly down-regulated in differentiated surface cells. Suppression of AC isoforms and G(s)alpha is functionally important, because their constitutive expression completely reverses differentiation-induced cAMP attenuation. Thus, down-regulation of AC isoforms and G(s)alpha is an integral part of the intestinal epithelial differentiation program, perhaps serving to release cells from cAMP-promoted anti-apoptosis as a prerequisite for cell death upon terminal differentiation.
Figures


Similar articles
-
Differentially expressed adenylyl cyclase isoforms mediate secretory functions in cholangiocyte subpopulation.Hepatology. 2009 Jul;50(1):244-52. doi: 10.1002/hep.22926. Hepatology. 2009. PMID: 19444869 Free PMC article.
-
Human bronchial smooth muscle cells express adenylyl cyclase isoforms 2, 4, and 6 in distinct membrane microdomains.J Pharmacol Exp Ther. 2011 Apr;337(1):209-17. doi: 10.1124/jpet.110.177923. Epub 2011 Jan 12. J Pharmacol Exp Ther. 2011. PMID: 21228062 Free PMC article.
-
Expression of type V adenylyl cyclase is required for epidermal growth factor-mediated stimulation of cAMP accumulation.J Biol Chem. 1995 Nov 17;270(46):27525-30. doi: 10.1074/jbc.270.46.27525. J Biol Chem. 1995. PMID: 7499211
-
Regulation and role of adenylyl cyclase isoforms.Annu Rev Pharmacol Toxicol. 2001;41:145-74. doi: 10.1146/annurev.pharmtox.41.1.145. Annu Rev Pharmacol Toxicol. 2001. PMID: 11264454 Review.
-
Tissue specificity and physiological relevance of various isoforms of adenylyl cyclase.Am J Physiol Renal Physiol. 2000 Sep;279(3):F400-16. doi: 10.1152/ajprenal.2000.279.3.F400. Am J Physiol Renal Physiol. 2000. PMID: 10966920 Review.
Cited by
-
Role of adenylyl cyclase 6 in the development of lithium-induced nephrogenic diabetes insipidus.JCI Insight. 2017 Apr 6;2(7):e91042. doi: 10.1172/jci.insight.91042. JCI Insight. 2017. PMID: 28405619 Free PMC article.
-
Physiological roles of mammalian transmembrane adenylyl cyclase isoforms.Physiol Rev. 2022 Apr 1;102(2):815-857. doi: 10.1152/physrev.00013.2021. Epub 2021 Oct 26. Physiol Rev. 2022. PMID: 34698552 Free PMC article. Review.
-
Adenylyl cyclase 3 haploinsufficiency confers susceptibility to diet-induced obesity and insulin resistance in mice.Sci Rep. 2016 Sep 28;6:34179. doi: 10.1038/srep34179. Sci Rep. 2016. PMID: 27678003 Free PMC article.
-
Transporter function and cyclic AMP turnover in normal colonic mucosa from patients with and without colorectal neoplasia.BMC Gastroenterol. 2012 Jun 26;12:78. doi: 10.1186/1471-230X-12-78. BMC Gastroenterol. 2012. PMID: 22734885 Free PMC article.
-
Transcriptome Based Estrogen Related Genes Biomarkers for Diagnosis and Prognosis in Non-small Cell Lung Cancer.Front Genet. 2021 Apr 14;12:666396. doi: 10.3389/fgene.2021.666396. eCollection 2021. Front Genet. 2021. PMID: 33936178 Free PMC article.
References
-
- Mariadason J. M., Nicholas C., L'Italien K. E., Zhuang M., Smartt H. J., Heerdt B. G., Yang W., Corner G. A., Wilson A. J., Klampfer L., Arango D., Augenlicht L. H. (2005) Gastroenterology 128, 1081–1088 - PubMed
-
- Olsen L., Bressendorff S., Troelsen J. T., Olsen J. (2005) Am. J. Physiol. Gastrointest. Liver Physiol. 289, G220–G226 - PubMed
-
- Traber P. G., Yu L., Wu G. D., Judge T. A. (1992) Am. J. Physiol. 262, G123–G130 - PubMed
-
- Zachos N. C., Tse M., Donowitz M. (2005) Annu. Rev. Physiol. 67, 411–443 - PubMed
Publication types
MeSH terms
Substances
Grants and funding
LinkOut - more resources
Full Text Sources

