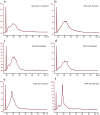
Use of bioanalyzer electropherograms for quality control and target evaluation in microarray expression profiling studies of ocular tissues
- PMID: 20157354
- PMCID: PMC2816811
- DOI: 10.1007/s12177-009-9046-2
Use of bioanalyzer electropherograms for quality control and target evaluation in microarray expression profiling studies of ocular tissues
Abstract
Expression profiling with DNA microarrays has been used to examine the transcriptome of a wide spectrum of vertebrate cells and tissues. The sensitivity and accuracy of the data generated is dependent on the quality and composition of the input RNA. In this report, we examine the quality and array performance of over 200 total RNA samples extracted from ocular tissues and cells that have been processed in a microarray core laboratory over a 7-year period. Total RNA integrity and cRNA target size distribution were assessed using the 2100 Bioanalyzer. We present Affymetrix GeneChip array performance metrics for different ocular samples processed according to a standard microarray assay workflow including several quality control checkpoints. Our review of ocular sample performance in the microarray assay demonstrates the value of considering tissue-specific characteristics in evaluating array data. Specifically, we show that Bioanalyzer electropherograms reveal highly abundant mRNAs in lacrimal gland targets that are correlated with variation in array assay performance. Our results provide useful benchmarks for other gene expression studies of ocular systems.
Figures


Similar articles
-
Quality control for microarray analysis of human brain samples: The impact of postmortem factors, RNA characteristics, and histopathology.J Neurosci Methods. 2007 Sep 30;165(2):198-209. doi: 10.1016/j.jneumeth.2007.06.001. Epub 2007 Jun 7. J Neurosci Methods. 2007. PMID: 17628689
-
Evaluation of quality-control criteria for microarray gene expression analysis.Clin Chem. 2004 Nov;50(11):1994-2002. doi: 10.1373/clinchem.2004.033225. Epub 2004 Sep 13. Clin Chem. 2004. PMID: 15364885
-
Validation and application of a high fidelity mRNA linear amplification procedure for profiling gene expression.Vet Immunol Immunopathol. 2005 May 15;105(3-4):331-42. doi: 10.1016/j.vetimm.2005.02.018. Vet Immunol Immunopathol. 2005. PMID: 15808310
-
Quality assessment of Affymetrix GeneChip data.OMICS. 2006 Fall;10(3):358-68. doi: 10.1089/omi.2006.10.358. OMICS. 2006. PMID: 17069513 Review.
-
RNA integrity and the effect on the real-time qRT-PCR performance.Mol Aspects Med. 2006 Apr-Jun;27(2-3):126-39. doi: 10.1016/j.mam.2005.12.003. Epub 2006 Feb 15. Mol Aspects Med. 2006. PMID: 16469371 Review.
Cited by
-
Genomic variation in captive deer mouse (Peromyscus maniculatus) populations.BMC Genomics. 2021 Sep 14;22(1):662. doi: 10.1186/s12864-021-07956-w. BMC Genomics. 2021. PMID: 34521341 Free PMC article.
-
Microcurrent Stimulation Triggers MAPK Signaling and TGF-β1 Release in Fibroblast and Osteoblast-Like Cell Lines.Cells. 2020 Aug 19;9(9):1924. doi: 10.3390/cells9091924. Cells. 2020. PMID: 32825091 Free PMC article.
-
Bioinformatics and the eye.J Ocul Biol Dis Infor. 2010 Feb 5;2(4):161-163. doi: 10.1007/s12177-009-9048-0. J Ocul Biol Dis Infor. 2010. PMID: 20157356 Free PMC article. No abstract available.
-
RNA isolation from micro-quantity of articular cartilage for quantitative gene expression by microarray analysis.Int J Med Sci. 2022 Jan 1;19(1):98-104. doi: 10.7150/ijms.65343. eCollection 2022. Int J Med Sci. 2022. PMID: 34975303 Free PMC article.
References
-
- Kiewe P, Gueller S, Komor M, Stroux A, Thiel E, Hofmann WK. Prediction of qualitative outcome of oligonucleotide microarray hybridization by measurement of RNA integrity using the 2100 Bioanalyzer capillary electrophoresis system. Ann Hematol. 2009;88:1177–83. doi: 10.1007/s00277-009-0751-5. - DOI - PubMed
-
- Jones L, Goldstein DR, Hughes G, Strand AD, Collin F, Dunnett SB, Kooperberg C, Aragaki A, Olson JM, Augood SJ, et al. Assessment of the relationship between pre-chip and post-chip quality measures for Affymetrix GeneChip expression data. BMC Bioinformatics. 2006;7:211. doi: 10.1186/1471-2105-7-211. - DOI - PMC - PubMed
-
- Agilent technologies application note: analysis of total RNA using the Agilent 2100 Bioanalyzer and the RNA 6000 LabChip kit. 2001 Available at: www.chem.agilent.com/Library/applications/59687493.pdf.
Grants and funding
LinkOut - more resources
Full Text Sources
