

Spectral distortion in diffuse molecular luminescence tomography in turbid media
- PMID: 20157444
- PMCID: PMC2821414
- DOI: 10.1063/1.3116130
Spectral distortion in diffuse molecular luminescence tomography in turbid media
Abstract
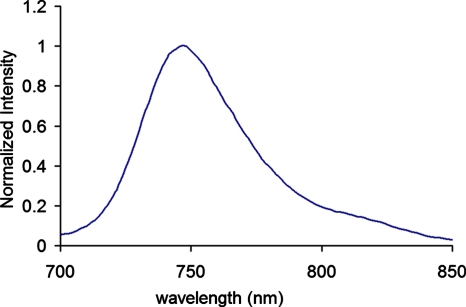
The influence of tissue optical properties on the shape of near-infrared (NIR) fluorescence emission spectra propagating through multiple centimeters of tissue-like media was investigated. Fluorescence emission spectra measured from 6 cm homogeneous tissue-simulating phantoms show dramatic spectral distortion which results in emission peak shifts of up to 60 nm in wavelength. Measured spectral shapes are highly dependent on the photon path length and the scattered photon field in the NIR amplifies the wavelength-dependent absorption of the fluorescence spectra. Simulations of the peak propagation using diffusion modeling describe the experimental observations and confirm the path length dependence of fluorescence emission spectra. Spectral changes are largest for long path length measurements and thus will be most important in human tomography studies in the NIR. Spectrally resolved detection strategies are required to detect and interpret these effects which may otherwise produce erroneous intensity measurements. This observed phenomenon is analogous to beam hardening in x-ray tomography, which can lead to image artifacts without appropriate compensation. The peak shift toward longer wavelengths, and therefore lower energy photons, observed for NIR luminescent signals propagating through tissue may readily be described as a beam softening phenomenon.
Figures


Similar articles
-
A neural network-based method for spectral distortion correction in photon counting x-ray CT.Phys Med Biol. 2016 Aug 21;61(16):6132-53. doi: 10.1088/0031-9155/61/16/6132. Epub 2016 Jul 29. Phys Med Biol. 2016. PMID: 27469292 Free PMC article.
-
A cascaded model of spectral distortions due to spectral response effects and pulse pileup effects in a photon-counting x-ray detector for CT.Med Phys. 2014 Apr;41(4):041905. doi: 10.1118/1.4866890. Med Phys. 2014. PMID: 24694136 Free PMC article.
-
Theoretical lateral and axial sensitivity limits and choices of molecular reporters for Cherenkov-excited luminescence in tissue during x-ray beam scanning.J Biomed Opt. 2020 Nov;25(11):116004. doi: 10.1117/1.JBO.25.11.116004. J Biomed Opt. 2020. PMID: 33185051 Free PMC article.
-
Cherenkov-excited Multi-Fluorophore Sensing in Tissue-Simulating Phantoms and In Vivo from External Beam Radiotherapy.Radiat Res. 2018 Feb;189(2):197-204. doi: 10.1667/RR14943.1. Epub 2017 Dec 18. Radiat Res. 2018. PMID: 29251551 Free PMC article.
-
Transmission and fluorescence angular domain optical projection tomography of turbid media.Appl Opt. 2009 Nov 20;48(33):6448-57. doi: 10.1364/AO.48.006448. Appl Opt. 2009. PMID: 19935964
Cited by
-
Implicit and explicit prior information in near-infrared spectral imaging: accuracy, quantification and diagnostic value.Philos Trans A Math Phys Eng Sci. 2011 Nov 28;369(1955):4531-57. doi: 10.1098/rsta.2011.0228. Philos Trans A Math Phys Eng Sci. 2011. PMID: 22006905 Free PMC article. Review.
-
Mathematical model to interpret localized reflectance spectra measured in the presence of a strong fluorescence marker.J Biomed Opt. 2016 Jun;21(6):61004. doi: 10.1117/1.JBO.21.6.061004. J Biomed Opt. 2016. PMID: 26836297 Free PMC article.
-
Čerenkov excited fluorescence tomography using external beam radiation.Opt Lett. 2013 Apr 15;38(8):1364-6. doi: 10.1364/OL.38.001364. Opt Lett. 2013. PMID: 23595486 Free PMC article.
-
In vivo bioluminescence tomography with a blocking-off finite-difference SP3 method and MRI/CT coregistration.Med Phys. 2010 Jan;37(1):329-38. doi: 10.1118/1.3273034. Med Phys. 2010. PMID: 20175496 Free PMC article.
-
Spectroscopic detection improves multi-color quantification in fluorescence tomography.Biomed Opt Express. 2011 Jan 31;2(3):431-9. doi: 10.1364/BOE.2.000431. Biomed Opt Express. 2011. PMID: 21412449 Free PMC article.
References
Grants and funding
LinkOut - more resources
Full Text Sources
Miscellaneous