. 2009:2009:bap003.
doi: 10.1093/database/bap003. Epub 2009 Apr 14.

Analysis of CASP8 targets, predictions and assessment methods

Affiliations

Analysis of CASP8 targets, predictions and assessment methods

Shuoyong Shi et al. Database (Oxford). 2009.

Abstract

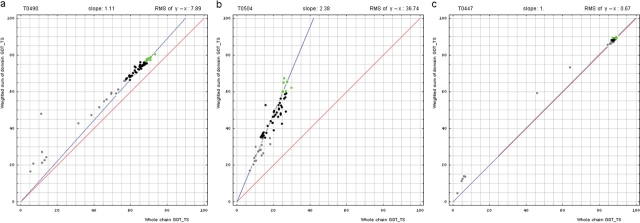
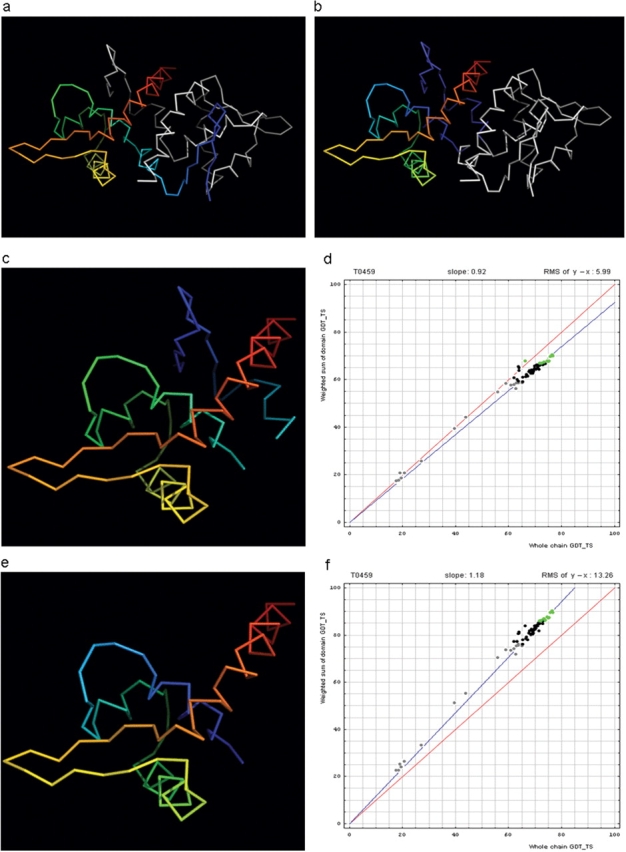
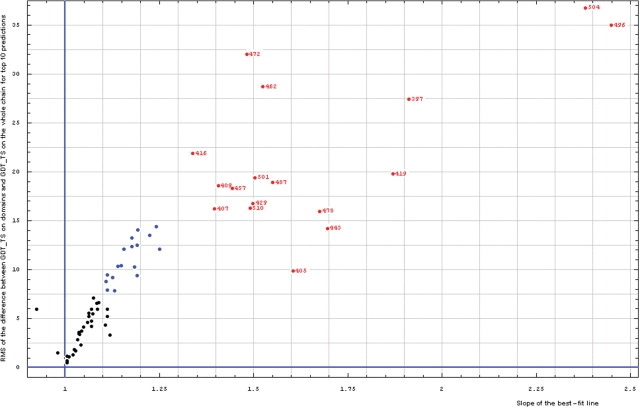
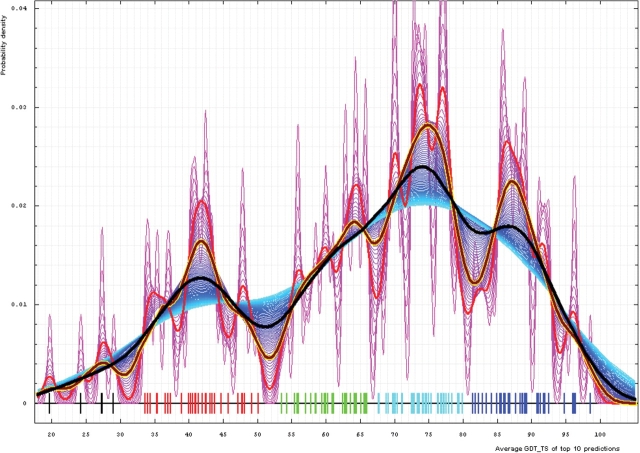
Results of the recent Critical Assessment of Techniques for Protein Structure Prediction, CASP8, present several valuable sources of information. First, CASP targets comprise a realistic sample of currently solved protein structures and exemplify the corresponding challenges for predictors. Second, the plethora of predictions by all possible methods provides an unusually rich material for evolutionary analysis of target proteins. Third, CASP results show the current state of the field and highlight specific problems in both predicting and assessing. Finally, these data can serve as grounds to develop and analyze methods for assessing prediction quality. Here we present results of our analysis in these areas. Our objective is not to duplicate CASP assessment, but to use our unique experience as former CASP5 assessors and CASP8 predictors to (i) offer more insights into CASP targets and predictions based on expert analysis, including invaluable analysis prior to target structure release; and (ii) develop an assessment methodology tailored towards current challenges in the field. Specifically, we discuss preparing target structures for assessment, parsing protein domains, balancing evaluations based on domains and on whole chains, dividing targets into categories and developing new evaluation scores. We also present evolutionary analysis of the most interesting and challenging targets.Database URL: Our results are available as a comprehensive database of targets and predictions at http://prodata.swmed.edu/CASP8.


Figures

Figure 1.
Figure 1.
Correlation between domain-based evaluation (y, vertical axis) and whole-chain GDT-TS (x, horizontal axis). (a) A typical correlation plot for target T0490. (b) A plot of target T0504 showing beneficial domain evaluation for this target. (c) A plot of target T0447 showing unnecessary domain evaluation for this target. Each point represents first server models. Green, gray and black points represent the top 10, the bottom 25% and the remaining prediction models, respectively. The blue line is the best-fit slope (intersection 0) to the top 10 server models. The red line is the diagonal. The slope and RMS y − x distance for the top 10 models (average difference between the weighted sum of domain GDT-TS scores and the whole-chain GDT-TS score) are shown above the plot.
Figure 2.
Figure 2.
Domain swap example (a) T0459 chain A (rainbow) with its symmetry mate (white). (b) T0459 chain A with a swapped N-terminal β-hairpin from its symmetry mate chain (rainbow) and the swapped hairpin symmetry mate chain (white). (c) Domain-swapped T0459 with chain B: 2–22 plus chain A: 23–106. (d) Correlation between GDT-TS scores for T0459 domain-based evaluation with a swapped domain (y, vertical axis) and whole-chain GDT-TS (x, horizontal axis). (e) T0459 with domain-swapped segment removed: chain A: 23–106. (f) Correlation between GDT-TS scores for T0459 domain-based evaluation with N-terminal segment removed (just A: 23–106, y, vertical axis) and whole-chain GDT-TS (x, horizontal axis).
Figure 3.
Figure 3.
Correlation between RMS of the difference between GDT-TS on domains and GDT-TS on the whole chain (vertical axis) and the slope of the best-fit line (horizontal axis), both computed on top 10 server predictions.
Figure 4.
Figure 4.
Gaussian kernel density estimation of domain GDT-TS scores for the first model GDT-TS averaged over top 10 servers and plotted at various bandwidths (= standard deviations). These average GDT-TS scores for all domains are shown as a spectrum along the horizontal axis: each bar represents a domain. The bars are colored according to the category suggested by this analysis: black, FM; red, FR; green, CM_H; cyan, CM_M; blue, CM_E. The family of curves with varying bandwidth is shown. Bandwidth varies from 0.3 to 8.2 GDT-TS% units with a step of 0.1, which corresponds to the color ramp from magenta through blue to cyan. Thicker curves: red, yellow-framed brown and black correspond to bandwidths 1, 2 and 4, respectively.
Figure 5.
Figure 5.
(a) Correlation between TR score (vertical axis) and GDT-TS (horizontal axis). (b) Correlation between contact score CS (vertical axis) and GDT-TS (horizontal axis). Scores for top 10 first server models were averaged for each domain shown by its number positioned at a point with the coordinates equal to these averaged scores. Domain numbers are colored according to the difficulty category suggested by our analysis: black, FM (free modeling); red, FR (fold recognition); green, CM_H (comparative modeling: hard); cyan, CM_M (comparative modeling: medium); blue, CM_E (comparative modeling: easy).
Figure 6.
Figure 6.
Dependence of GDT-TS (vertical axis) on domain length (horizontal axis). Each point represents a random score for a domain. All NMR models for each domain are used, and random scores for them appear as vertical streaks giving an idea about random errors of random scores. The red curve is the best-fit of the function mentioned in the text. On the upper right, one example indicates the procedure generating random structures. Random structure 1: permuted and residue 1 is placed at position 6 of the original structure; random structure 2: reverse chain and random structure 3: reverse chain, permuted and residue 1 is placed at position 6 of the reverse chain structure.
Figure 7.
Figure 7.
(a) Cartoon diagram of N-terminal domain of T0397: 3d4r chain A residues 7–82. (b) Structure and topology diagrams of ferredoxin fold–fold closest to T0397 N-terminal domain. (c) Ribbon diagram of N-terminal domain of T0496: 3d09 chain A, residues 4–126. (d) Structure and topology diagrams of RNAseH fold–fold closest to T0496  N domain.
Figure 8.
Figure 8.
(a1) Cartoon diagram of T0467: 2k5q model 1, residues 7–97. (a2) Ribbon diagram of T0467 OB-fold C-terminal terminal region and Sso7d SH3-fold C-terminal region. Left: T0467 OB-fold C-terminal fragment: 2k5q model 1, residues 64–97; Right: Sso7d SH3-fold C-terminal fragment: 2bf4 chain A residues 30–64. On the bottom of this panel, a sequence alignment between 2k5q and 2bf4 indicates the sequence similarity between OB-fold and SH3-fold. (a3) Ribbon diagram of T0467 global OB-fold and Sso7d global SH3-fold. Left: T0467 OB-fold: 2k5q model 1, residues 7–97; Right: Sso7d SH3-fold: 2bf4 chain A. (b1) Cartoon diagram of T0465 and two typical proteins with FYSH domain. Left: Cartoon diagram of T0465, 3dfd chain A residues 21–136; Middle: FYSH domain of hypothetical protein AF0491: 1t95 chain A residues 11–94; Right: FYSH domain of hypothetical protein Yhr087W: 1nyn chain A residues 1–93. (b2) Cartoon diagram of T0465 and the closest template 2bo9. Left: Cartoon diagram of T0465: 3dfd chain A residues 11–137; Right: bacteriophage HK97 tail assembly chaperone: 2ob9 chain A. (c1) Cartoon diagram of T0443 evolutionary domains: 3dee, N- and C-terminal domains are colored blue and red, respectively. (c2) Cartoon diagram of N-terminal domain of T0443: 3dee residues 31–117. (c3) Middle domain of eIFα: 2aho chain B residues 96–176 belongs to SAM-domain fold. (c4) Four helices from a cyclin domain: 1gh6 chain B 648-733. (c5) Cartoon diagram of C-terminal domain of T0443: 3dee residues 118–230, HTH helices are orange-yellow and orange, ‘wing’ strands are blue and red (c6) Left: classic-winged HTH in biotin repressor: 1bia residues 1–63, HTH helices are green and yellow, ‘wing’ strands are orange and red; Right: circularly permuted HTH in Met aminopeptidase: 1b6a 378-446, HTH helices are yellow and orange, ‘wing’ strands are blue and red. (c7) 2nd HTH in cullin: 1ldj chains A:586–673, B:19–28, HTH helices are green and lime, ‘wing’ strands are yellow and orange, side β-sheet is red and blue. (c8) HTH domain of PhoB: 1qqi residues 10–104, HTH helices are green and yellow-orange, ‘wing’ strands are orange and red, side β-sheet is blue-cyan. (d1) Left: cartoon diagram of T0510 domains: 3doa, N-terminal, middle and C-domains are shown in blue, green and red, respectively; Right: cartoon diagram of MutM domains: 1ee8_A, N-terminal, middle and C-terminal domains are shown in blue, green and red, respectively, Zn ion is shown as a white ball. (d2) Left: N-terminal domain of 510: 3doa residues 1–165; Right: N-terminal domain of MutM: 1ee8 chain A residues 1–121. (d3) Left: N-terminal domain of 510: 3doa residues 1–165 insertion close to the N-terminus is red; Right: N-terminal domain of MutM: 1ee8 chain A residues 1–121 insertion in the middle of the domain is blue. (d4) Left: N-terminal domain of 510: 3doa residues 236–279; Right: N-terminal domain of MutM: 1ee8 chain A residues 230–266.

Similar articles

Cited by

References

    1. Moult J, Pedersen JT, Judson R, et al. A large-scale experiment to assess protein structure prediction methods. Proteins. 1995;23:ii–v. - PubMed
    1. Moult J. A decade of CASP: progress, bottlenecks and prognosis in protein structure prediction. Curr. Opin. Struct. Biol. 2005;15:285–289. - PubMed
    1. Altschul SF, Madden TL, Schaffer AA, et al. Gapped BLAST and PSI-BLAST: a new generation of protein database search programs. Nucleic Acids Res. 1997;25:3389–3402. - PMC - PubMed
    1. Andreeva A, Howorth D, Chandonia JM, et al. Data growth and its impact on the SCOP database: new developments. Nucleic Acids Res. 2008;36:D419–D425. - PMC - PubMed
    1. Shammas C, Menne TF, Hilcenko C, et al. Structural and mutational analysis of the SBDS protein family. Insight into the leukemia-associated Shwachman-Diamond Syndrome. J. Biol. Chem. 2005;280:19221–19229. - PubMed