. 2009:2009:bap010.
doi: 10.1093/database/bap010. Epub 2009 Sep 29.

QuickGO: a user tutorial for the web-based Gene Ontology browser

Affiliations

QuickGO: a user tutorial for the web-based Gene Ontology browser

Rachael P Huntley et al. Database (Oxford). 2009.

Abstract

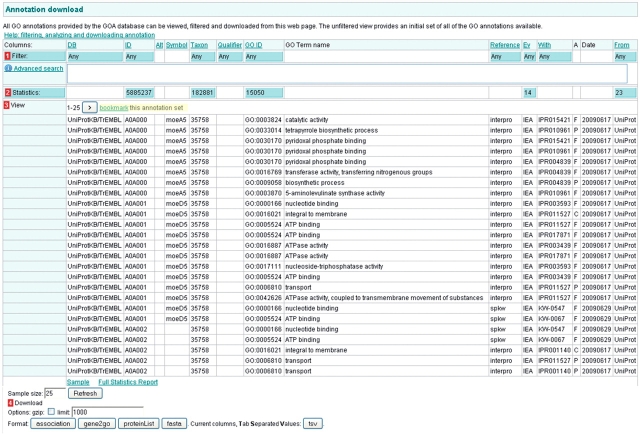
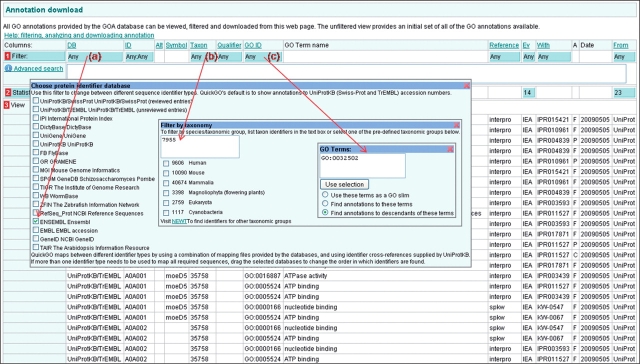
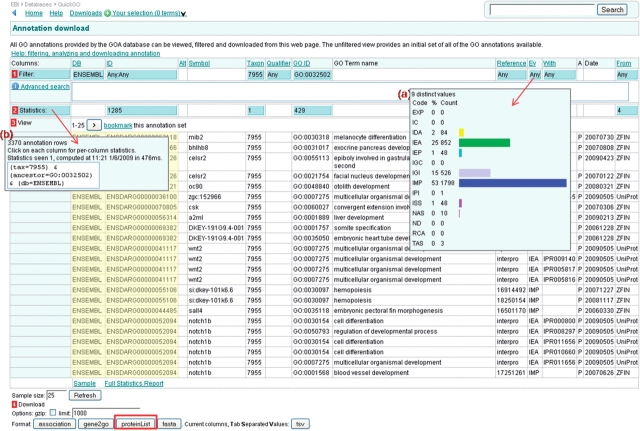
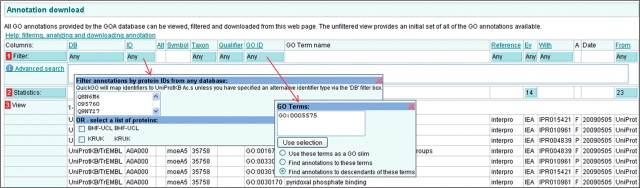
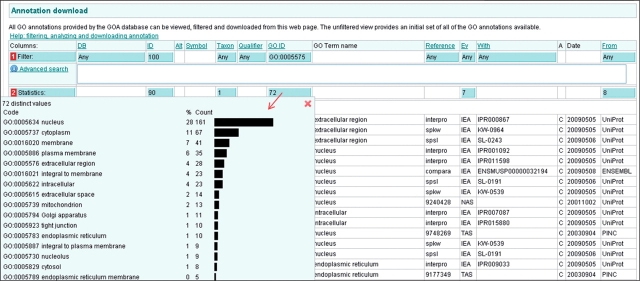
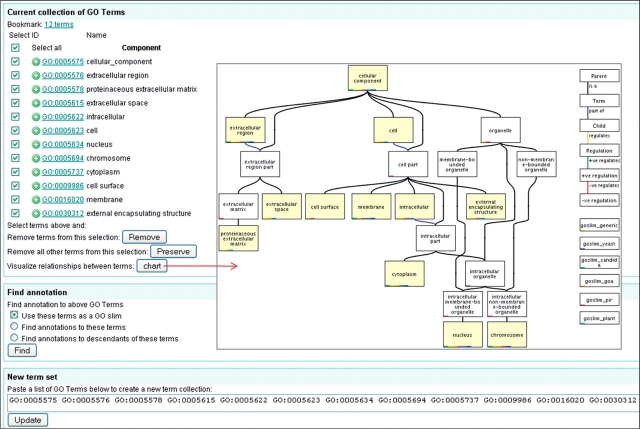
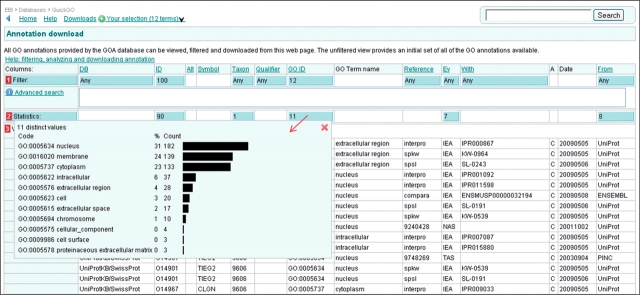
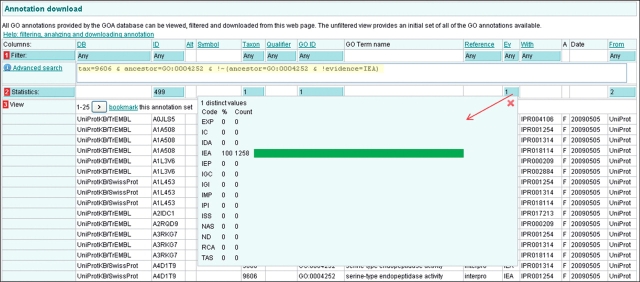
The Gene Ontology (GO) has proven to be a valuable resource for functional annotation of gene products. At well over 27 000 terms, the descriptiveness of GO has increased rapidly in line with the biological data it represents. Therefore, it is vital to be able to easily and quickly mine the functional information that has been made available through these GO terms being associated with gene products. QuickGO is a fast, web-based tool for browsing the GO and all associated GO annotations provided by the GOA group. After undergoing a redevelopment, QuickGO is now able to offer many more features beyond simple browsing. Users have responded well to the new tool and given very positive feedback about its usefulness. This tutorial will demonstrate how some of these features could be useful to the researcher wanting to discover more about their dataset, particular areas of biology or to find new ways of directing their research.Database URL:http://www.ebi.ac.uk/QuickGO.


Figures

Figure 1.
Figure 1.
A section of the Cellular Component part of the Gene Ontology showing the term ‘retromer complex’. The term has three parent terms; ‘membrane part’, ‘endomembrane system’ and ‘protein complex’ and two child terms; ‘retromer complex, outer shell’ and ‘retromer complex, inner shell’. Relationships between the terms are indicated by coloured lines (edges) joining the terms, the different relationships are displayed in the key in the right panel.
Figure 2.
Figure 2.
The front page of QuickGO. Most of QuickGO's functionality can be accessed from this page (http://www.ebi.ac.uk/QuickGO/).
Figure 3.
Figure 3.
The Information page for ‘nucleus’, the page is organised into five tabs which contain all the information for a GO term including its GO ID, definition, synonyms, position within the ontology, relationship to its parent and child terms, proteins associated with the term and the terms which are most commonly co-assigned with the term.
Figure 4.
Figure 4.
Filtering by protein/gene identifier. This filter is used to find annotations to a list of genes or proteins; several sequence identifier types can be searched in QuickGO.
Figure 5.
Figure 5.
Filtering by taxonomy. This filter is used to find annotations to selected species; common taxon identifiers are provided, alternatively a list can be entered into the text box or the link to UniProtKB Taxonomy can be used to search for identifiers.
Figure 6.
Figure 6.
Filtering by GO identifier. Annotations to particular GO terms can be displayed by using this filter. The chosen terms can also be used to create a GO slim.
Figure 7.
Figure 7.
Filtering by Evidence Code. This filter is used to find annotations made using selected evidence codes, for example the electronic annotations (IEA code) could be filtered out.
Figure 8.
Figure 8.
Mapping annotations to a different sequence identifier. QuickGO displays annotations to UniProtKB accessions by default, but is able to map annotations to a number of different identifier types.
Figure 9.
Figure 9.
The Annotation Download page is the starting point for creating custom sets of GO annotation. Annotations can be filtered using the blue ‘Filter’ boxes in the row labelled with a red ‘1’, clicking on a blue box will result in a pop-up box explaining what filtering options are available on that column. Statistics are available for many of the columns and are calculated on the fly as annotation sets are refined. Statistics are accessed from the blue boxes in the row labelled with a red ‘2’. Data from the annotation set can be downloaded in various formats – the options are shown at the red ‘4’ – but the limit must be set for the number of annotations in the set (obtained from the blue ‘Statistics’ box). There is also an option to gzip the download file. Annotation sets may be bookmarked by clicking on the ‘bookmark this annotation set’ link (yellow highlight).
Figure 10.
Figure 10.
Case 1. Customizing a set of annotations by selecting a sequence identifier-type and filtering on taxonomic identifier and GO term. (a) The ‘DB’ filter is used to change between identifier types. (b) Enter a taxonomic identifier or click the link to search for one. (c) Enter a GO term identifier and select the ‘Find annotations to descendants of these terms’ to find annotations to that GO term and its child terms. Once all the required filters have been selected, click outside of the filter box and then click on the ‘Load’ button to see the customized set of annotation.
Figure 11.
Figure 11.
Case 1. A customized annotation set. Ensembl identifiers have been selected (yellow highlight); (a) statistics for the evidence codes—almost 900 are electronic annotations; (b) the ‘statistics’ box displays the number of total annotations in the set; the user required a list of genes implicated with developmental process, this list can be downloaded using the ‘proteinList’ format download option (red box).
Figure 12.
Figure 12.
Case 2. The GOA annotation set is filtered by inputting a list of UniProtKB protein accessions into the ‘ID’ filter box and the GO ID for ‘cellular component’ into the ‘GO ID’ filter box and finally choosing to find annotations to the child terms of cellular component. Clicking away from the filter box will reveal a ‘Load’ button, which will produce a table of the customized annotation set.
Figure 13.
Figure 13.
Case 2. The GO ID statistics displays all the GO terms in the annotation set and a percentage and count of each GO term. These statistics are useful for creating bar graphs for publication.
Figure 14.
Figure 14.
Case 2. Mapping-up annotations using a GO slim (I). The GO slim page of QuickGO containing the 12 GO terms is shown. Terms can be added or removed from the list on this page and terms can be charted to show their relationship to each other. Once a set is finalized, annotation can be mapped-up by selecting to use the terms as a GO slim.
Figure 15.
Figure 15.
Case 2. Mapping–up annotations using a GO slim (II). Annotations to proteins from the breast cancer-related list were slimmed to 12 cellular component terms to give an overview of the location of these proteins. The table displays the slimmed-up cellular component annotations for the list of proteins. The ‘GO ID’ statistics shows the percentage and count of annotations to each term. These statistics are useful for producing a bar graph for publication.
Figure 16.
Figure 16.
Case 3. Advanced querying in QuickGO. QuickGO is well placed for finding proteins that have no experimentally evidenced annotation since it is one of the few web-based GO browsers to include IEA annotations. This query (yellow highlighting) shows all human proteins which are annotated to the GO term ‘serine-type endopeptidase activity’ using only electronic annotation methods. The list of proteins could be used as a basis for designing experiments.
Figure 17.
Figure 17.
Case 3. Excerpt from a tab separated values file of electronic annotations to the GO term ‘serine-type endopeptidase activity’ for human proteins including the electronic methods used to make the predictions. Proteins B4DR21 (purple highlight) and P00750 (blue highlight) have annotations predicted by more than one electronic method, increasing the confidence that the predicted activity may be carried out.
Figure 18.
Figure 18.
Case 4. Co-occurrence statistics for the term ‘apoptosis’. Users can choose which evidence codes should be used in the calculation. Commonly co-annotated terms are shown.
Figure 19.
Figure 19.
Case 4. ‘Your selection’ basket. Terms can be collected, whilst browsing, by clicking on the green ‘add’ button. The selected terms and their relationship to each other can be displayed as a chart by clicking the ‘View selected terms’ link.
Figure 20.
Figure 20.
Case 4. ‘Activity’ terms commonly co-occurring with ‘apoptosis’. The activity-type terms were selected and viewed in context as a chart to make it easy to see any significant enzyme activities associated with apoptosis.
Figure 21.
Figure 21.
Case 4. Subcellular location terms commonly co-occurring with ‘apoptosis’. The cellular component terms were selected and viewed in context as a chart to make it easy to see any significant subcellular locations associated with apoptosis-related gene products.

Similar articles

Cited by

References

    1. Bult CJ, Eppig JT, Kadin JA, et al. The Mouse Genome Database (MGD): mouse biology and model systems. Nucleic Acids Res. 2008;36:D724–D728. - PMC - PubMed
    1. Carbon S, Ireland A, Mungall CJ, et al. AmiGO: online access to ontology and annotation data. Bioinformatics. 2009;25:288–289. - PMC - PubMed
    1. Côté RG, Jones P, Apweiler R, et al. The Ontology Lookup Service, a lightweight cross-platform tool for controlled vocabulary queries. BMC Bioinformatics. 2006;7:97. - PMC - PubMed
    1. Pereira GS, Brandão RM, Giuliatti S, et al. Gene Class expression: analysis tool of Gene Ontology terms with gene expression data. Genet. Mol. Res. 2006;5:108–114. - PubMed
    1. Pirooznia M, Habib T, Perkins EJ, et al. GOfetcher: a database with complex searching facility for gene ontology. Bioinformatics. 2008;24:2561–2563. - PubMed