. 2009:2009:bap011.
doi: 10.1093/database/bap011. Epub 2009 Sep 17.

The Prion Disease Database: a comprehensive transcriptome resource for systems biology research in prion diseases

Affiliations

The Prion Disease Database: a comprehensive transcriptome resource for systems biology research in prion diseases

Nils Gehlenborg et al. Database (Oxford). 2009.

Abstract

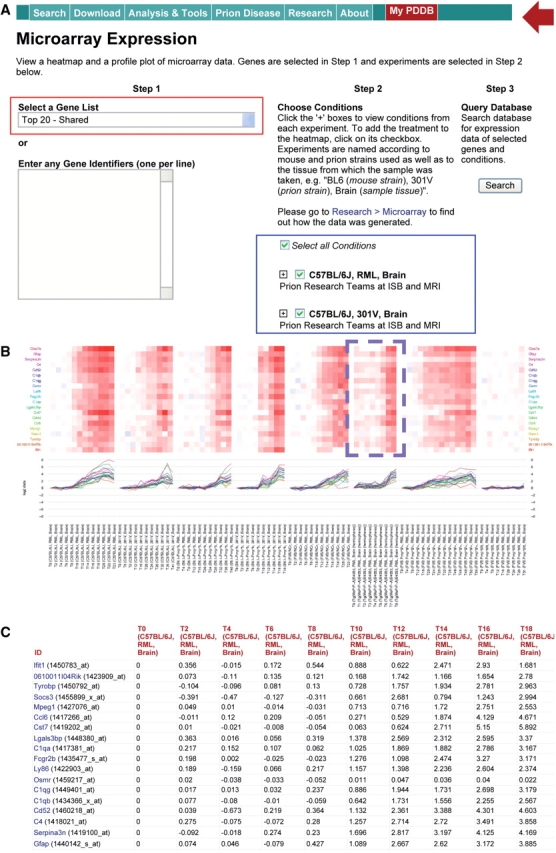
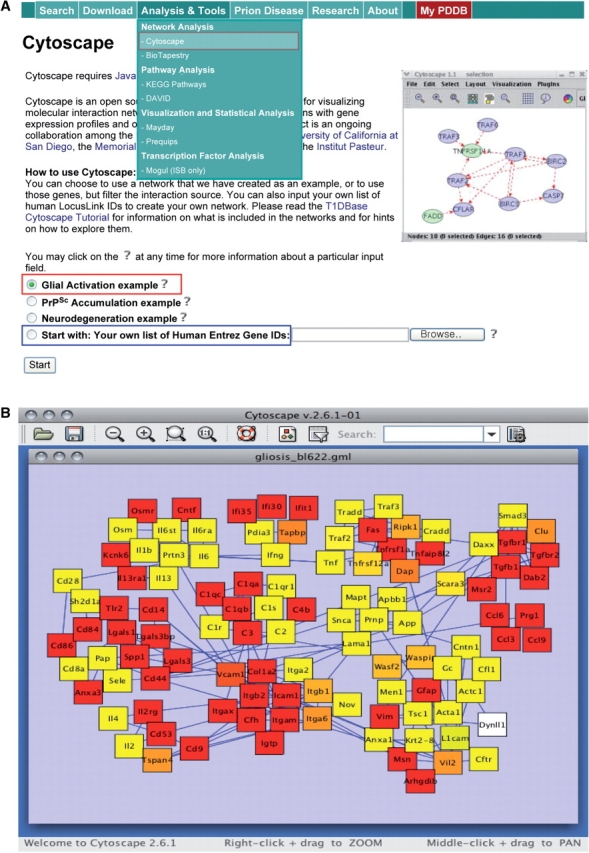
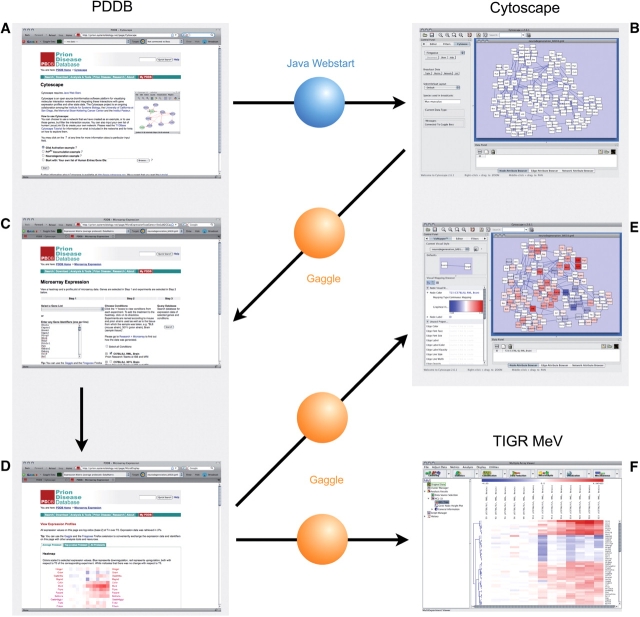
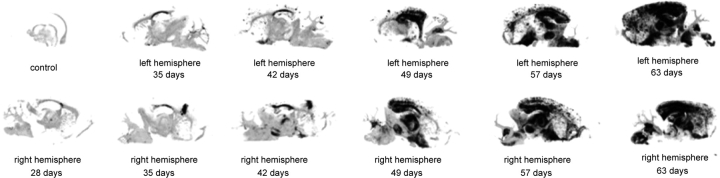
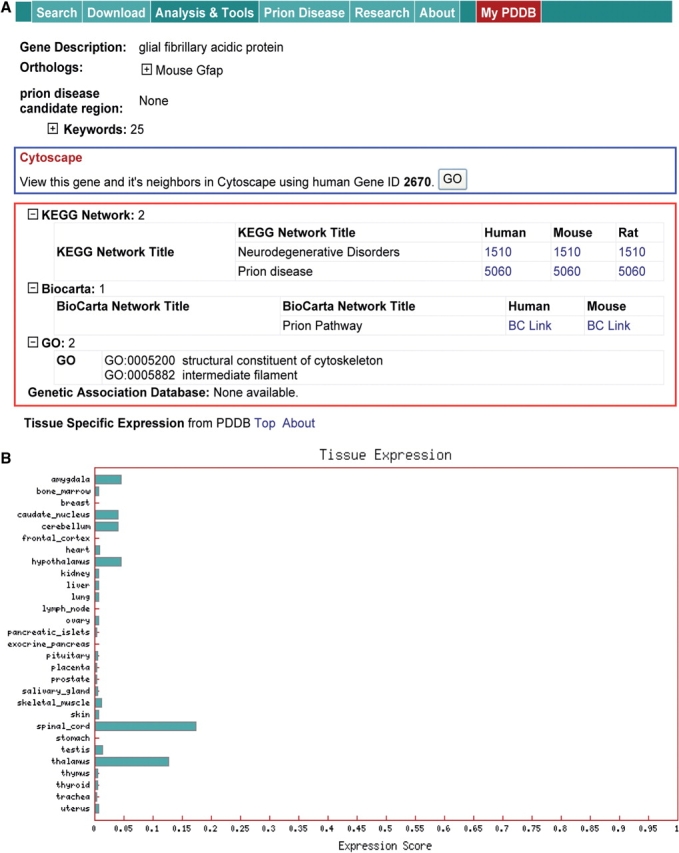
Prion diseases reflect conformational conversion of benign isoforms of prion protein (PrP(C)) to malignant PrP(Sc) isoforms. Networks perturbed by PrP(Sc) accumulation and their ties to pathological events are poorly understood. Time-course transcriptomic and phenotypic data in animal models are critical for understanding prion-perturbed networks in systems biology studies. Here, we present the Prion Disease Database (PDDB), the most comprehensive data resource on mouse prion diseases to date. The PDDB contains: (i) time-course mRNA measurements spanning the interval from prion inoculation through appearance of clinical signs in eight mouse strain-prion strain combinations and (ii) histoblots showing temporal PrP(Sc) accumulation patterns in brains from each mouse-prion combination. To facilitate prion research, the PDDB also provides a suite of analytical tools for reconstructing dynamic networks via integration of temporal mRNA and interaction data and for analyzing these networks to generate hypotheses.Database URL:http://prion.systemsbiology.net.


Figures

Figure 1.
Figure 1.
Exploration of temporal gene expression profiles. (A) Gene expression search comprising (i) selection of a predefined set of genes (top 20 shared DEGs) or entering of a set of the genes to be explored and (ii) selection of a set of mouse–prion strain combinations to be searched. (B) Heatmaps and profile plots showing temporal gene expression patterns of the top 20 shared DEGs in all mouse–prion strain combinations. (C) Log2 fold changes of the top 20 shared DEGs in the combinations (only the fold changes in BL6-RML are shown).
Figure 2.
Figure 2.
Reconstruction and exploration of hypothetical networks. (A) Network reconstruction involving either selection of a predefined network from our study or entering a set of genes for which a network can be built. (B) A glial activation network describing diverse immune responses to prion accumulation (see the text for further details). This example network can serve as a platform network to build more comprehensive networks by expanding particular network modules to include relevant cellular processes.
Figure 3.
Figure 3.
Exchange of data between the PDDB and external tools through the Gaggle. (A) Network reconstruction within the PDDB. (B) Loading the network into Cytoscape through Java Webstart. (C) Broadcasting the gene symbols corresponding to the network nodes back to the PDDB through the CyGoose. (D) Querying the PDDB for the list of gene symbols from CyGoose in the Microarray Expression page. (E) The retrieved expression matrices can be broadcast back to Cytoscape through the Firegoose and be used to provide node colors using VizMapper. (F) The expression matrices can be also broadcast to other tools such as the TIGR MeV for further analyses (e.g. clustering). See the text for further details.
Figure 4.
Figure 4.
Histoblots representing PrPSc accumulation during the course of prion infection. An example set of histoblots from left and right brain hemispheres of Tg4053-RML showing significant PrPSc accumulation after 49 days.
Figure 5.
Figure 5.
Gene page information. (A) Protein interactions (the blue box), and database information (KEGG and Biocarta pathways and GO information). (B) Tissue specific expression information that can support prediction of diagnostic marker candidates.

Similar articles

Cited by

References

    1. Hood L, Heath JR, Phelps ME, et al. Systems biology and new technologies enable predictive and preventative medicine. Science. 2004;306:640–643. - PubMed
    1. Lin B, White JT, Lu W, et al. Evidence for the presence of disease-perturbed networks in prostate cancer cells by genomic and proteomic analyses: a systems approach to disease. Cancer Res. 2005;65:3081–3091. - PubMed
    1. Price ND, Edelman L, Lee I, et al. Systems biology and the emergence of systems medicine. In: Willard HF, Ginsburg GS, editors. Genomic and Personalized Medicine: From Principles to Practice. I. New York: Academic Press; 2009. pp. 74–85.
    1. Prusiner SB. Prions. Proc. Natl Acad. Sci. USA. 1998;95:13363–13383. - PMC - PubMed
    1. Prusiner SB. Prion Biology and Diseases. 2nd. 2003. Cold Spring Harbor Laboratory Press, pp. 1–88. - PubMed