. 2009 Dec 31;1(12):1008-16.
doi: 10.18632/aging.100115.

Quantifying pharmacologic suppression of cellular senescence: prevention of cellular hypertrophy versus preservation of proliferative potential

Affiliations

Quantifying pharmacologic suppression of cellular senescence: prevention of cellular hypertrophy versus preservation of proliferative potential

Zoya N Demidenko et al. Aging (Albany NY). .

Abstract

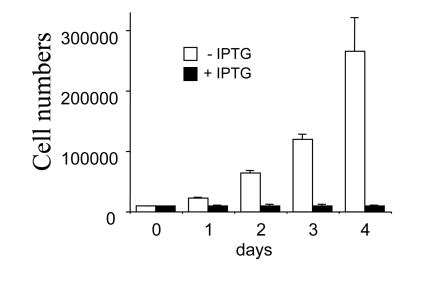
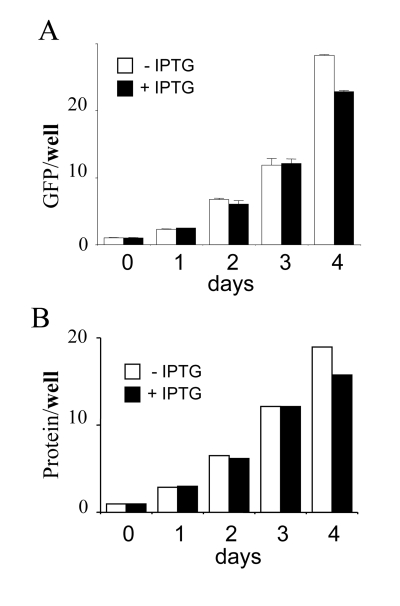
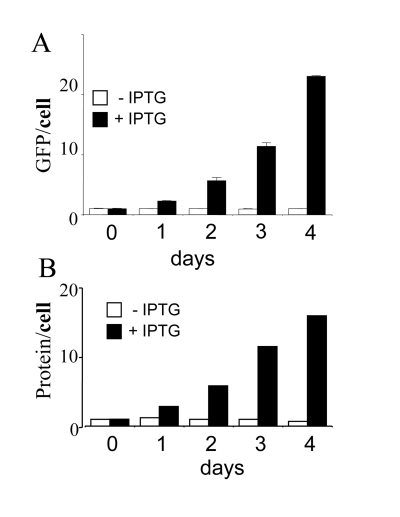
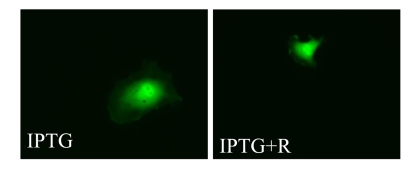
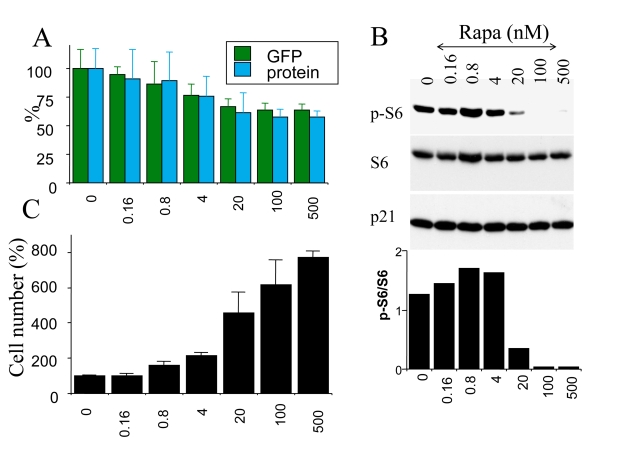
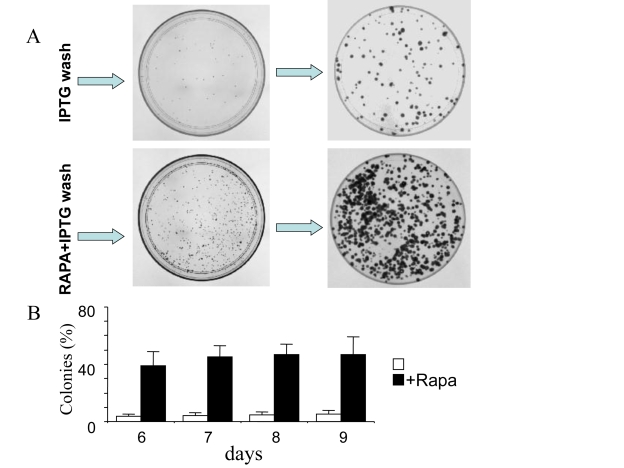
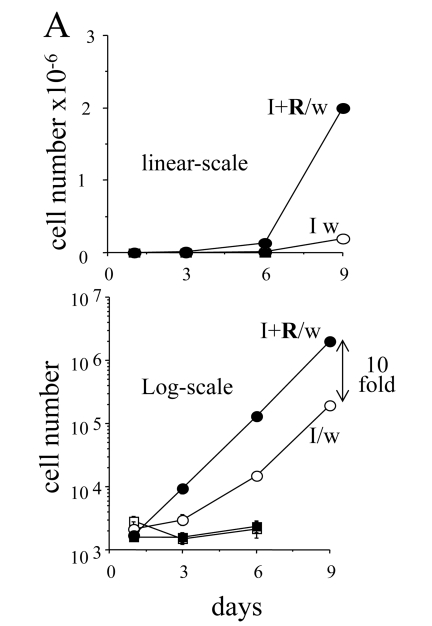
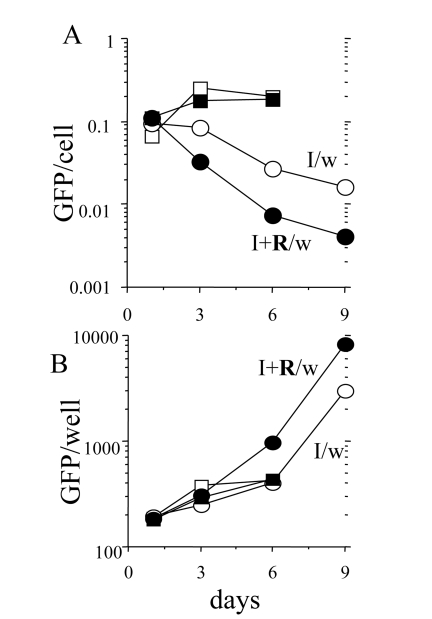
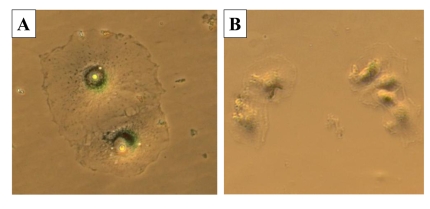
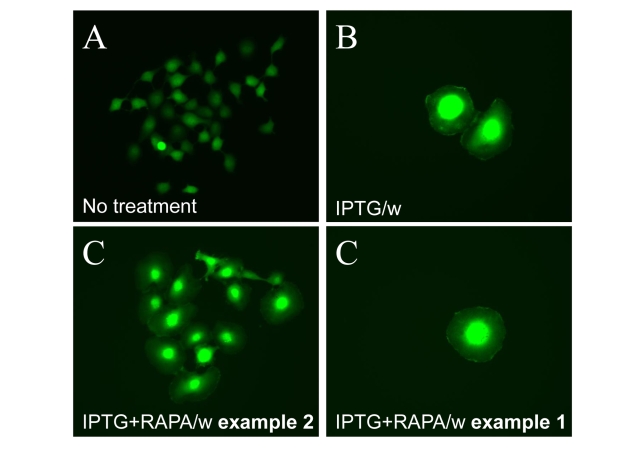
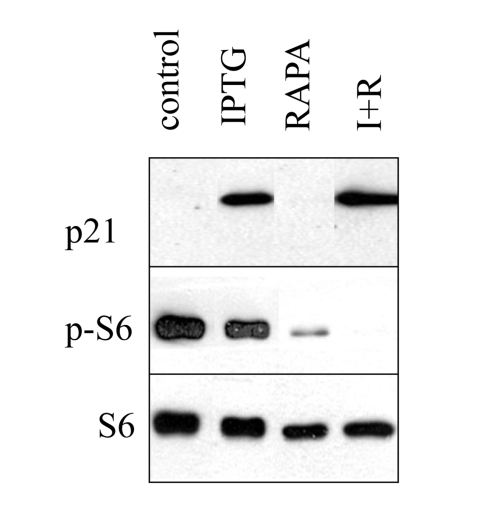
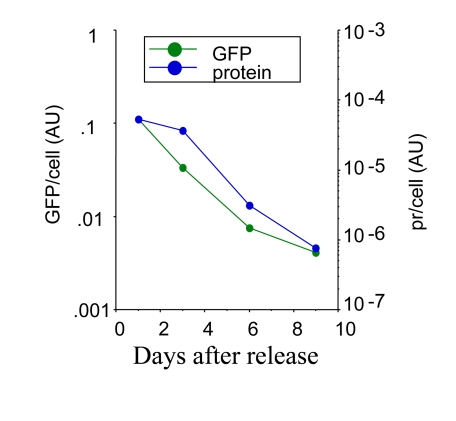
Development of agents that suppress aging (aging suppressants) requires quantification of cellular senescence. Cellular senescence in vitro is characterized by a large cell morphology and permanent loss of proliferative potential. When HT-1080 cells were arrested by p21, they continued to grow exponentially in size and became hypertrophic with a 15-fold increase in the protein content per cell. These changes were mirrored by accumulation of GFP (driven by CMV promoter) per cell, which also served as a marker of cellular hypertrophy. Preservation of proliferative potential (competence) was measured by an increase in live cell number, when p21 was switched off. While modestly decreasing hypertrophy in p21-arresrted cells, rapamycin considerably preserved competence, converting senescence into quiescence. Preservation of proliferative potential (competence) correlated with inhibition of S6 phosphorylation by rapamycin. When p21 was switched off, competent cells, by resuming proliferation, became progressively less hypertrophic. Preservation of proliferative potential is a sensitive and quantitative measure of suppression of mTOR-driven senescence.

Keywords: aging-suppression; cellular hypertrophy; cellular senescence; mTOR; rapamycin.


Conflict of interest statement

MVB is a founder of Oncotarget.

Figures

Figure 1.
Figure 1.. Inhibition of cell proliferation by IPTG.
Closed bars: HT-p21 cells were treated with IPTG (+IPTG). Cells do not proliferate. Open bars: Untreated HT-p21 cells. Exponentially proliferating cells. Cells were counted daily.
Figure 2.
Figure 2.. Total cellular mass growth during senescence induction.
HT-p21 cells were grown in 60 mm wells and soluble protein and GFP were measured daily. Closed bars: HT-p21 cells were treated with IPTG (+IPTG). Open bars: Untreated HT-p21 cells (-IPTG). In both proliferating (-IPTG) and non-proliferating (+IPTG) conditions, protein per well and GFP per well were increasing. In panel B, protein was measured in duplicate and shown without standard deviations, therefore statistical difference between –IPTG and + IPTG should not be considered. The panel simply illustrates exponential growth in both conditions.
Figure 3.
Figure 3.. Cellular hypertrophy during senescence induction.
HT-p21 cells were grown in 60 mm wells and cell numbers, soluble protein and GFP were measured daily. Closed bars: HT-p21 cells were treated with IPTG (+IPTG). Open bars: Untreated HT-p21 cells (-IPTG). Protein per cell and GFP per cell were constant in proliferating (-IPTG) cells. Protein per cell and GFP per cell increased exponentially in non-proliferating (+IPTG) cells.
Figure 4.
Figure 4.. Visualization of cellular hypertrophy.
HT-p21 cells express enhanced green fluorescent protein (GFP) under the constitutive viral CMV promoter. Expression of GFP per cell is a marker of cellular hypertrophy. Low cell density - 2 thousand cells were plated in 100 mm dish and treated with either IPTG or IPTG + Rapamycin.
Figure 5.
Figure 5.. Correlation between S6 phosphorylation, hypertrophy and loss of proliferative potential in senescent cells.
HT-p21 cells were plated in 6 well plates and treated with IPTG plus the increasing concentrations of rapamycin (from 0.16 to 500 nM). At concentration 0, cells were treated with IPTG alone. (A) Cellular hypertrophy: protein and GFP. After 3 days, soluble protein and GFP were measured per well. [Note: in non-proliferating cells, protein/well is a measure of protein/cells]. Results are shown as percent of IPTG alone (0) without rapamycin. (B) After 3 days, cells were lysed and immunobloted for p-S6, S6 and p21. (C) PC: preservation of proliferative competence. After 3 days, cells were washed to remove IPTG and RAPA. Cells were incubated for additional 5 days in the fresh medium and then were counted. Results are shown as percent of IPTG alone (0) without rapamycin.
Figure 6.
Figure 6.. Clonal proliferation of competent cells.
HT-p16 cells were plated in 100-mm plates. The next day, 50 μM IPTG with or without rapamycin, if indicated (RAPA), was added. After 3 days, the plates were washed to remove IPTG and RAPA. (A) Photographs. Upper panel: On days 5 and 8 (after IPTG removal), plates were fixed, stained and photographed. Lower panel: On days 5 and 8 (after IPTG removal), plates were fixed, stained and photographed. (B) Number of colonies. On days 6, 7, 8 and 9 (after IPTG removal), plates were fixed, stained and photographed. The number of colonies was counted and results are shown as percent of plated cells in log-scale.
Figure 7.
Figure 7.. The dynamics of cell numbers.
500 HT-p21 cells were plated in 12 well plates. On the next day, either IPTG alone (I) or IPTG plus rapamycin (I+R) were added. After 3 days, plates were washed (I/w and I+R/w) or left unwashed. Cells were counted at days 1, 3, 6 and 9. Upper panel: linear-scale. Lower panel: log-scale. Open and closed squares: IPTG and IPTG plus Rapa, respectively. Open and closed circles: IPTG washed (I/w) and IPTG plus Rapa washed (I+R/w), respectively. In the presence of IPTG (open squares) and IPTG plus rapamycin (closed squares), the cells did not proliferate.
Figure 8.
Figure 8.. Loss of hypertrophy during proliferation of competent cells.
500 HT-p21 cells were plated in 12 well plates. The next day, either IPTG alone or IPTG plus rapamycin were added. After 3 days, plates were washed (I/w and I+R/w) or left unwashed. GFP per well was measured and cells were counted at days 1, 3, 6 and 9. GFP per cell was calculated (upper panel). Results are shown in arbitrary units (M±m). Open and closed squares: IPTG and IPTG plus Rapa, respectively. Open and closed circles: IPTG washed (I/w) and IPTG plus Rapa washed (I+R/w), respectively. When cells resumed exponential proliferation, GFP per cell dropped to normal levels. Due to robust proliferation, there was an increase of GFP per well.
Figure 9.
Figure 9.. The morphology of cells during recovery.
500 HT-p21 cells were plated in 12 well plates. The next day, IPTG (A) or IPTG plus rapamycin (B) was added. After 3 days, plates were washed and microphotographs were taken after additional 3 days. Cells were stained for beta-Gal. A: I/w; B: I+R/w.
Figure 10.
Figure 10.. Visualization of loss of hypertrophy during proliferation of competent cells.
500 HT-p21 cells (A) were treated with IPTG (B) or IPTG plus rapamycin (C), as indicated, or left untreated. After 3 days, plates were washed and incubated without drugs to allow proliferation. (A) Normal size of proliferating cells. (B) Cellular hypertrophy of senescent cells. (C) Example 1. Clonal proliferation of competent cells results in loss of hypertrophy. (C) Example 2. Cells that remained arrested remained hypertrophic.
Figure S1.
Figure S1.. Induction of p21 by IPTG.
HT-p21 cells were plated in 6 well plates and treated with IPTG with or without rapamycin as indicated. The next day, cells were lysed and immunoblot for p-S6, S6 and p21 was performed as described in Methods. IPTG dramatically induced p21, without affecting S6 phosphorylation, whereas rapamycin inhibited S6 phosphorylation, without affecting p21 induction.
Figure S2.
Figure S2.. Loss of hypertrophy following release.
HT-p21 cells were treated with IPTG plus 500 nM rapamycin for 3 days. Then the cells were washed and the cells were incubated in the fresh medium without drugs. At indicated days, soluble protein, GFP and cell numbers were measured per well. Protein (pr) per cell and GFP per cell were calculated and plotted in arbitrary units.

Similar articles

Cited by

References

    1. Serrano M, Blasco MA. Putting the stress on senescence. Curr Opin Cell Biol. 2001;13:748–53. - PubMed
    1. Shay JW, Roninson IB. Hallmarks of senescence in carcinogenesis and cancer therapy. Oncogene. 2004;23:2919–2933. - PubMed
    1. Ferbeyre G, de Stanchina E, Lin AW, Querido E, McCurrach ME, Hannon GJ, Lowe SW. Oncogenic ras and p53 cooperate to induce cellular senescence. Mol Cell Biol. 2002;22:3497–3508. - PMC - PubMed
    1. Ruggero D, Montanaro L, Ma L, Xu W, Londei P, Cordon-Cardo C, Pandolfi PP. The translation factor eIF-4E promotes tumor formation and cooperates with c-Myc in lymphomagenesis. Nat Med. 2004;10:484–486. - PubMed
    1. Efeyan A, Ortega-Molina A, Velasco-Miguel S, Herranz D, Vassilev LT, Serrano M. Induction of p53-dependent senescence by the MDM2 antagonist nutlin-3a in mouse cells of fibroblast origin. Cancer Res. 2007;67:7350–7357. - PubMed

MeSH terms

Substances