. 2010 Oct;136(10):1497-505.
doi: 10.1007/s00432-010-0807-x. Epub 2010 Feb 16.

The influence of TXNDC5 gene on gastric cancer cell

Affiliations

The influence of TXNDC5 gene on gastric cancer cell

Lin Zhang et al. J Cancer Res Clin Oncol. 2010 Oct.

Abstract

Background: TXNDC5 (thioredoxin domain containing 5) is over-expressed in tumors of the cervix, uterus, stomach and lung. However, not much is known about the functional roles of TXNDC5 gene in gastric adenocarcinoma. In the present study, we intend to investigate the effects of TXNDC5 on the growth, proliferation, apoptosis, invasion and cell cycle of the gastric cancer cell line MKN45 and normal gastric cell line HFE145.

Methods: TXNDC5 cDNA was inserted into a constitutive vector pcDNA3.1 followed by transfection into normal gastric cell line HFE145 using liposome. Then, stable transfectants were selected and appraised. Specific silencing of TXNDC5 gene was achieved using a vector-based short interference RNAs (siRNA) system in gastric cancer cell line MKN45. The growth and proliferation were analyzed by cell growth curves and colony-forming assay, respectively. The apoptosis and cell cycles of these clones were analyzed using flow cytometry. The invasion of these cells was analyzed by cell migration assay. The TXNDC5 stable expression cell lines (HFE-TXNDC5) and TXNDC5 RNAi cell lines (MKN-SR1,2) were detected and compared with their control groups, respectively.

Results: HFE-TXNDC5 grew faster than HFE145 and HFE-PC(HFE145 transfected with pcDNA3.1 vector). MKN-SR1 grew slower than MKN45 and MKN-SS1,2 (MKN45 transfected with scrambled control duplexes). The cell counts of HFE-TXNDC5 in the fifth, sixth and seventh days were significantly higher than those of control groups (P < 0.05). The cell counts of MKN-SR1 in the fifth, sixth and seventh days were significantly lower than those of control groups (P < 0.05). Cell cycle analysis showed that there were significant differences in proportions of G0-G1 and G2-M phase between HFE-TXNDC5, MKN-SR1 cells and their control groups, respectively (P < 0.05). The apoptosis rate of HFE-TXNDC5 was significantly lower than that of control groups (P < 0.05). The results of colony-forming assay showed that the colony formation rate of HFE-TXNDC5 was higher than those of control groups, otherwise the rate of MKN-SR1 were lower than those of their control groups (P < 0.05). The results of cell migration assay showed that the migration rate of HFE-TXNDC5 were significantly higher than that of its control group. Conversely, the migration rate of MKN-SR1 was significantly lower than that of its control group (P < 0.05).

Conclusion: TXNDC5 can promote the growth and proliferation of gastric cells. Silencing of TXNDC5 can restrain the growth and proliferation of gastric cancer cells. The gene can enhance the capability of invasion of gastric cancer cells. In some respects, TXNDC5 could be thought as a tumor-enhancing gene in gastric cancer.


Figures

Fig. 1
Fig. 1
The RT-PCR results of TXNDC5 in HFE-TXNDC5, HFE-PC cells and HFE145. HT were the results of RT-PCR for TXNDC5 and β-actin control in HFE-TXNDC5 cell, HP were the results of RT-PCR for TXNDC5 and β-actin control in HFE-PC cell. H were those in HFE145 cell. The results showed that there was expression of TXNDC5 gene in HFE-TXNDC5 cell, but no expression in HFE-PC or untreated HFE145 cell
Fig. 2
Fig. 2
The results of immunocytochemical analysis of TXNDC5 in HFE-PC and HFE-TXNDC5 cells (SP ×400). a There was no brown positive signal in HFE-PC cell. b The brown positive signals were mainly distributed in cytoplasm of HFE-TXNDC5 cells. The results showed that there was expression of TXNDC5 gene in HFE-TXNDC5 cell line, but no TXNDC5 expression in HFE-PC cell line
Fig. 3
Fig. 3
The western blot results of TXNDC5 in HFE-TXNDC5, HFE-PC and HFE-145 cells. HT were the results of western blot for TXNDC5 and β-actin control in HFE-TXNDC5 cell, HP were the results of western blot for TXNDC5 and β-actin control in HFE-PC cell, H were those in HFE-145 cell. The results showed that there was expression of TXNDC5 gene in HFE-TXNDC5 cell, but no expression in HFE-PC or HFE-145 cell
Fig. 4
Fig. 4
The RT-PCR results of TXNDC5 in MKN-SR1, MKN-SR2, MKN-SS1, MKN-SS2 and MKN45 cells. a MR1 and MR2 were the results of RT-PCR for TXNDC5 and β-actin control in MKN-SR1 and MKN-SR2 cells, respectively, MS1 and MS2 were the results of RT-PCR for TXNDC5 and β-actin control in MKN-SS1 and MKN-SS1 cells, respectively. M was that in untreated MKN45 cell. The results showed that the expression level of TXNDC5 gene in MKN-SR1 cells decreased when compared with the MKN-SR2 and other control groups. b Levels of TXNDC5 and β-actin mRNA expression of cells were detected by RT-PCR 5 days after siRNA transfection. About 30% relative expression rates in MKN-SR1 groups was detected when compared with untreated MKN45. The relative expression rates of MKN-SR2 and other groups were not different significantly
Fig. 5
Fig. 5
The immunocytochemistry results of TXNDC5 in MKN-SS1 and MKN-SR1 cell lines (SP ×200). a The brown positive signals were mainly distributed in cytoplasm of MKN-SS1 cells. b The brown positive signals were mainly distributed in cytoplasm of MKN-SR1 and the intensity of positive signals decreased when compared with that of MKN-SS1 cells. The results showed that the expression of TXNDC5 gene in MKN-SR1 cell line was downregulated
Fig. 6
Fig. 6
The western blot results of TXNDC5 in MKN-SR1, MKN-SR2, MKN-SS1, MKN-SS2 and MKN45 cells. a MR1 and MR2 were the results of western blot for TXNDC5 and β-actin control in MKN-SR1 and MKN-SR2 cells, respectively, MS1 and MS2 were the results of western blot for TXNDC5 and β-actin control in MKN-SS1 and MKN-SS2 cells, respectively. M were those in untreated MKN45 cell line. The results showed that the expression level of TXNDC5 gene in MKN-SR1 cell line was downregulated when compared with those in MKN-SR2 and control groups. b Expression levels of TXNDC5 and β-actin proteins of cells detected by western blot 5 days after siRNA transfection. About 20% relative expression rates in MKN-SR1 groups could be detected when compared with untreated MKN45
Fig. 7
Fig. 7
The growth curves of HFE-TXNDC5, HFE-PC, HFE-145, MKN-SR1, MKN-SR2, MKN-SS1, MKN-SS2 and MKN45 cells. a The growth curves of HFE-TXNDC5, HFE-PC and HFE145 groups. The unit of vertical axis was ×105, horizontal axis was the number of days. It was showed that HFE-TXNDC5 cells grew significantly faster than HFE-PC and untreated HFE-145 cells, respectively, in the growth curves. b The growth curves of MKN-SR1, MKN-SR2, MKN-SS1, MKN-SS2 and MKN45 groups. The unit of vertical axis was ×105, horizontal axis was the number of days. It was showed that MKN-SR1 cells grew significantly slower than MKN-SR2, MKN-SS1, MKN-SS2 and MKN45 cells, respectively, in the growth curves
Fig. 8
Fig. 8
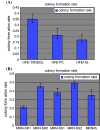
The results of colony formation assay of HFE-TXNDC5, HFE-PC, HFE-145, MKN-SR1, MKN-SR2, MKN-SS1, MKN-SS2 and MKN45 cells. a The results of colony formation assay of HFE-TXNDC5, HFE-PC and HFE-145 groups. The results showed that the colony formation rate of HFE-TXNDC5 cell line was significantly higher than those of its control groups, respectively. b The results of colony formation assay of MKN-SR1, MKN-SR2, MKN-SS1, MKN-SS2 and MKN45 groups. The results showed that the colony formation rate of MKN-SR1 cell line was significantly lower than those of MKN-SR2 and their control groups, respectively
Fig. 9
Fig. 9
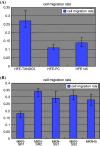
The results of cell migration assay of HFE-TXNDC5, HFE-PC, HFE-145, MKN-SR1, MKN-SR2, MKN-SS1, MKN-SS2 and MKN45 cells. a The results of cell migration assay of HFE-TXNDC5, HFE-PC and HFE-145 groups. The results showed that the cell migration rate of HFE-TXNDC5 cell line was significantly higher than those of its control groups, respectively. b The results of cell migration assay of MKN-SR1, MKN-SR2, MKN-SS1, MKN-SS2 and MKN45 cells. The results showed that the cell migration rate of MKN-SR1 cell line was significantly lower than those of their control groups, respectively

Similar articles

Cited by

References

    1. Arber N, Shapira I, Ratan J, Stern B, Hibshoosh H, Moshkowitz M, Gammon M, Fabian I, Halpern Z (2000) Activation of c-K-ras mutations in human gastrointestinal tumors. Gastroenterology 118:1045–1050 - PubMed
    1. Calcagno DQ, Leal MF, Seabra AD, Khayat AS, Chen ES, Demachki S, Assumpcao PP, Faria MH, Rabenhorst SH, Ferreira MV, de Arruda Cardoso Smith M, Burbano RR (2006) Interrelationship between chromosome 8 aneuploidy, C-MYC amplification and increased expression in individuals from northern Brazil with gastric adenocarcinoma. World J Gastroenterol 12:6207–6211 - PMC - PubMed
    1. Claudio JO, Masih-Khan E, Tang H, Gonçalves J, Voralia M, Li ZH, Nadeem V, Cukerman E, Francisco-Pabalan O, Liew CC, Woodgett JR, Stewart AK (2002) A molecular compendium of genes expressed in multiple myeloma. Blood 100(6):2175–2186 - PubMed
    1. Clissold PM, Bicknell R (2003) The thioredoxin-like fold: hidden domains in protein disulphide isomerases and other chaperone proteins. Bioessays 25:603–611 - PubMed
    1. Correa P (1992) Human gastric carcinogenesis: a multistep and multifactorial process—First American Cancer society Award Lecture on Cancer Epidemiology and Prevention. Cancer Res 52:6735–6740 - PubMed

Substances