Review
. 2010 Mar;15(1):85-100.
doi: 10.1007/s10911-010-9170-4. Epub 2010 Feb 17.

The epigenetic landscape of mammary gland development and functional differentiation

Affiliations
Review

The epigenetic landscape of mammary gland development and functional differentiation

Monique Rijnkels et al. J Mammary Gland Biol Neoplasia. 2010 Mar.

Abstract

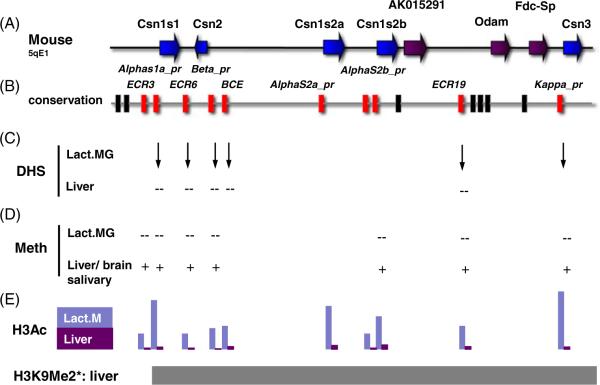
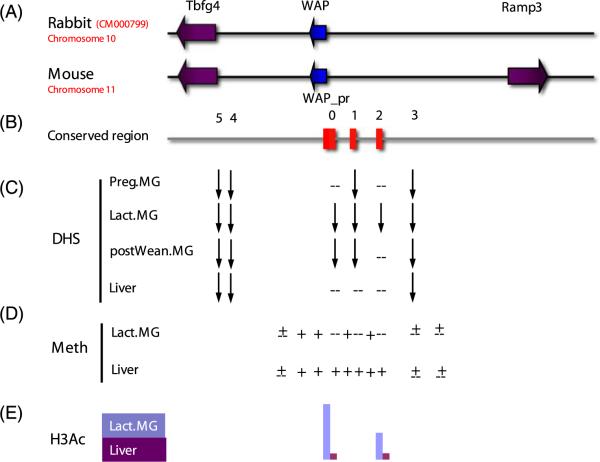
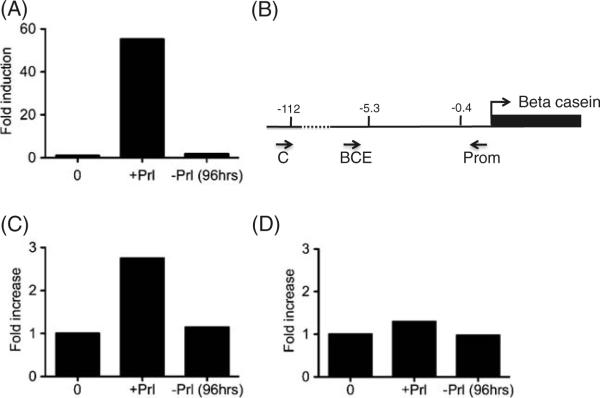
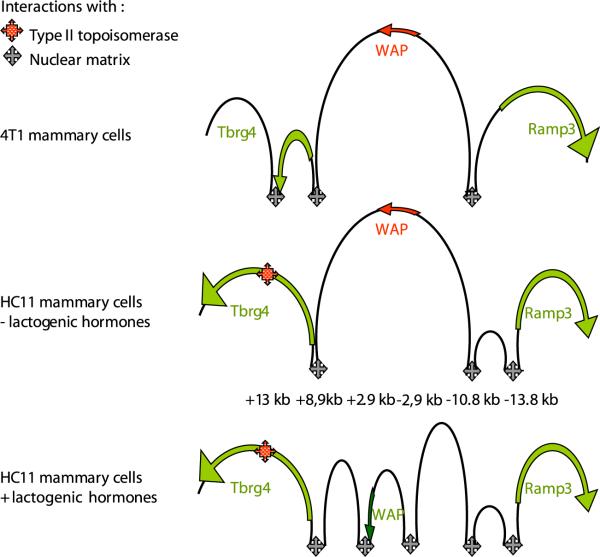
Most of the development and functional differentiation in the mammary gland occur after birth. Epigenetics is defined as the stable alterations in gene expression potential that arise during development and proliferation. Epigenetic changes are mediated at the biochemical level by the chromatin conformation initiated by DNA methylation, histone variants, post-translational modifications of histones, non-histone chromatin proteins, and non-coding RNAs. Epigenetics plays a key role in development. However, very little is known about its role in the developing mammary gland or how it might integrate the many signalling pathways involved in mammary gland development and function that have been discovered during the past few decades. An inverse relationship between marks of closed (DNA methylation) or open chromatin (DnaseI hypersensitivity, certain histone modifications) and milk protein gene expression has been documented. Recent studies have shown that during development and functional differentiation, both global and local chromatin changes occur. Locally, chromatin at distal regulatory elements and promoters of milk protein genes gains a more open conformation. Furthermore, changes occur both in looping between regulatory elements and attachment to nuclear matrix. These changes are induced by developmental signals and environmental conditions. Additionally, distinct epigenetic patterns have been identified in mammary gland stem and progenitor cell sub-populations. Together, these findings suggest that epigenetics plays a role in mammary development and function. With the new tools for epigenomics developed in recent years, we now can begin to establish a framework for the role of epigenetics in mammary gland development and disease.


Figures

Figure 1
Figure 1
Tissue specific epigenetic marks in the mouse casein gene cluster. a Graphic depiction of the mouse casein gene region. Indicating genes in the region: Csn1s1 (alpha S1 casein), Csn2 (beta), Csn1s2a (alpha S2a), Csn1s2b (alpha S2b), AK015291 (EST), Odam, Fdc-Sp, Csn3 (kappa casein) location and direction of transcription are indicated. b Location of ECRs base on multi-species comparative sequence analysis of 14 mammalian species (Human, chimpanzee, macaque, marmoset, galago, rabbit, mouse, rat, cow, dog, shrew, armadillo, elephant and opossum) using MultiPipMaker [187]. Red indicates analyzed ECR (c) Summary of preliminary results of DNaseI Hypersensitive site mapping of lactating/late-pregnant mammary gland and liver tissue. HS are indicated with an arrow, − no HS. d Preliminary results of DNA methylation analysis of HpaII sites and/or bisulfite sequencing: presence of DNA methylation is indicated with a +, − no methylation with −. e Graphical depiction of Histone H3 acetylation on selected regions of the casein locus based on ChIP of lactating mammary gland (lavender box) and liver (purple box) analyzed by real-time PCR or regular PCR. *H3K9Me2 LOCK in liver based on data from [188].
Figure 2
Figure 2
Tissue and developmental stage specific epigenetic marks in the WAP region: a Graphic depiction of the WAP genomic region in rabbit chromosome 10 (genbank: CM000799)(top) and mouse chromosome 11 (UCSC browser) (bottom) location and direction of transcriptional are indicated. Note: the Ramp3 gene has not been identified in rabbit. b Location of conserved regions based on mouse and rabbit comparative sequence analysis (from Millot et al 2003 [69]) numbers indicate DNaseI hypersensitive sites [57, 69]). c Summary results of DNaseI Hypersensitive site mapping of lactating mammary gland and liver tissue in rabbit [57, 69]). DHS are indicated with an arrow, − no DHS. d Results of DNA methylation analysis using methylation sensitive restriction enzyme. Presence of DNA methylation is indicated with a +, no methylation with–, intermediate methylation with ± [57]. e Graphical depiction of Histone H3 acteylation (IP/input) on selected regions of the WAP locus (promoter and lactation specific HSS2) based on ChIP of lactating mammary gland (lavender box) and liver (purple box) analyzed by real-time PCR.
Figure 3
Figure 3
Detection of loop formations between beta casein gene regulatory elements in HC11 cells induced with lactogenic hormones and after withdrawal of hormones. a Beta casein gene expression induction 24 hrs after addition of lactogenic hormones and 96 hrs after subsequent withdrawal of Prl, determined by Q-RT-PCR as described in Kabotyanski et al 2009 [83]. b Location (Kb) of HindIII sites and primers used to determine looping in 3C assay from [83]. c Fold increase of looping between the β-casein gene promoter and the BCE after addition of Prl and subsequent withdrawal of Prl. d As in C for the β-casein promoter and far upstream control, C, region.
Figure 4
Figure 4
Linear representation of chromatin loop interactions with the nuclear matrix around the WAP gene. In mouse mam-mary 4T1 cells (ATCC®: CRL-2539™) or in mouse mammary HC11 cells incubated in the presence (+) or absence (−) of lactogenic hormones [154], expressed genes are depicted in green, gene which are not expressed are in red. The interactions with the nuclear matrix listed in Table I or with type II topoisomerase are indicated by grey (nuclear matrix) or red (type II topoisomerase) symbols.
Figure 5
Figure 5
Methylation status of Pinc during mammary gland development: Pinc is a pregnancy upregulated long-non-coding RNA. DNA was isolated from MEC preparations or non-MEC (or fatpad) for 3 week and 6-week-old virgin animals, 8 day lactating mammary gland and liver. DNA was treated with Bisulfite [37], PCR amplified with primers specific for Pinc promoter region and PCR fragments were directly sequenced. Presence of a T-peak in chromatogram at location of CpG after BS treatment and sequencing indicates hypomethylation (no fill) while presence of a C-peak indicates hypermethylation (dark gray fill).

Similar articles

Cited by

References

    1. Topper YJ, Freeman CS. Multiple interactions in the developmental biology of the mammary gland. Physiol Rev. 1980;80:1049–56. - PubMed
    1. Stein T, Morris JS, Davies CR, et al. Involution of the mouse mammary gland is associated with an immune cascade and an acute-phase response, involving LBP, CD14 and STAT3. Breast Cancer Res. 2004;6:R75–91. - PMC - PubMed
    1. Master SR, Stoddard AJ, Bailey LC, Pan TC, Dugan KD, Chodosh LA. Genomic analysis of early murine mammary gland development using novel probe-level algorithms. Genome Biol. 2005;6:R20. - PMC - PubMed
    1. McBryan J, Howlin J, Kenny PA, Shioda T, Martin F. ERalpha-CITED1 co-regulated genes expressed during pubertal mammary gland development: implications for breast cancer prognosis. Oncogene. 2007;26:6406–19. - PubMed
    1. Rudolph MC, McManaman JL, Phang T, et al. Metabolic regulation in the lactating mammary gland: a lipid synthesizing machine. Physiol Genomic. 2007;28:323–36. - PubMed

Publication types

MeSH terms

LinkOut - more resources