. 2011 Mar;15(3):612-24.
doi: 10.1111/j.1582-4934.2010.01034.x.

MafA promotes the reprogramming of placenta-derived multipotent stem cells into pancreatic islets-like and insulin+ cells

Affiliations

MafA promotes the reprogramming of placenta-derived multipotent stem cells into pancreatic islets-like and insulin+ cells

Shih-Hwa Chiou et al. J Cell Mol Med. 2011 Mar.

Abstract

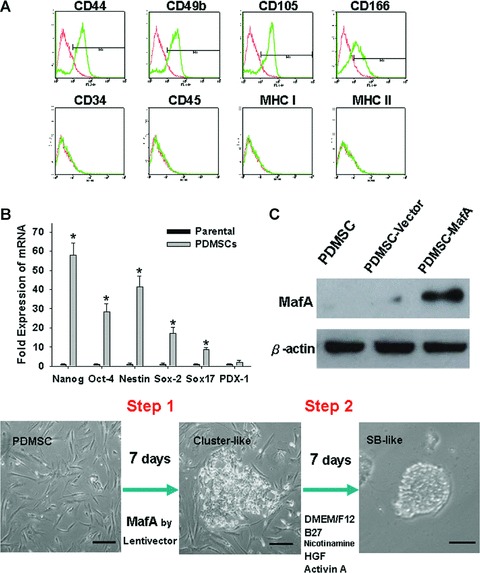
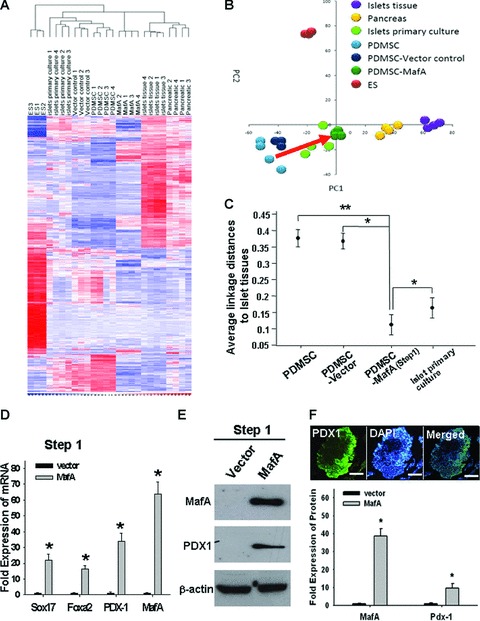
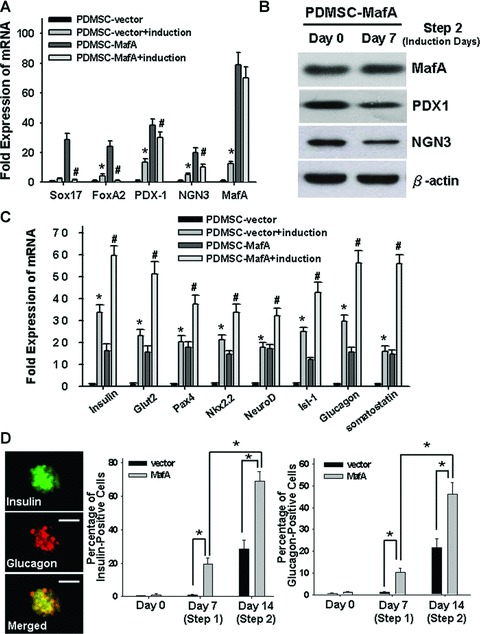
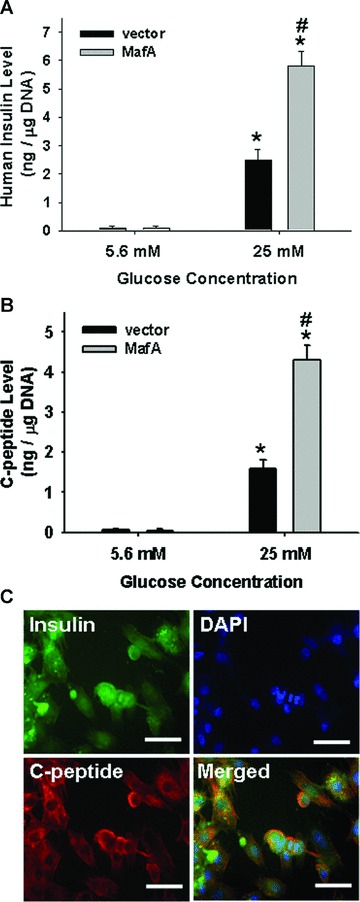
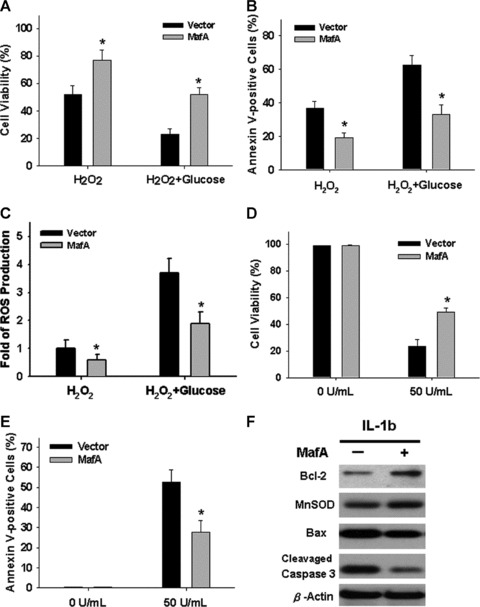
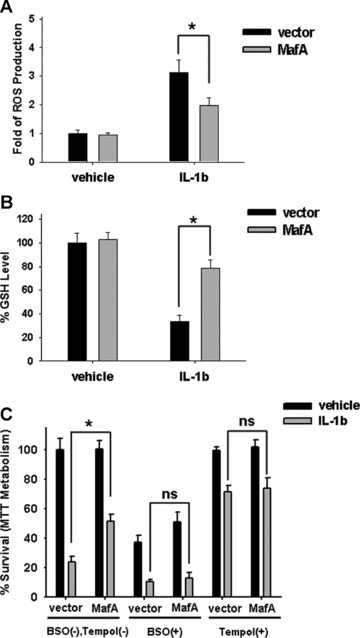
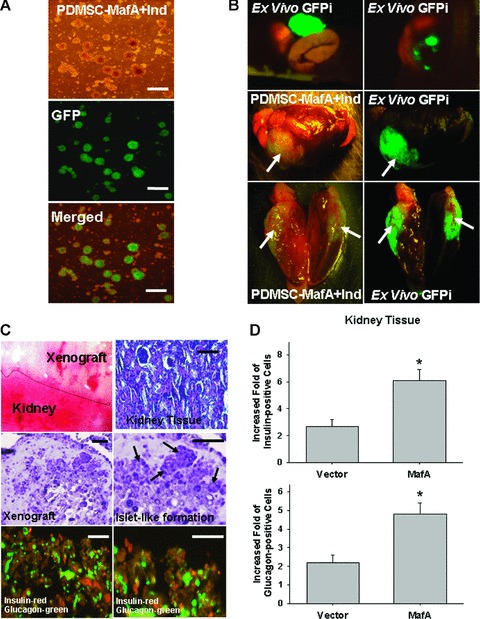
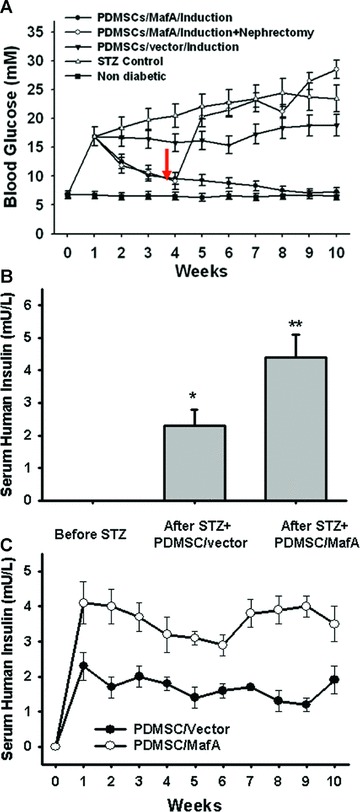
MafA is a pancreatic transcriptional factor that controls β-cell-specific transcription of the insulin gene. However, the role of MafA in the regulation of pancreatic transdifferentiation and reprogramming in human stem cells is still unclear. In this study, we investigate the role of MafA in placenta-derived multipotent stem cells (PDMSCs) that constitutively expressed Oct-4 and Nanog. PDMSCs were isolated and transfected with MafA using a lentivector. Our results showed that overexpression of MafA in PDMSCs significantly up-regulated the expression of pancreatic development-related genes (Sox17, Foxa2, Pdx1 and Ngn3). Microarray analysis suggested that the gene expression profile of MafA-overexpressing PDMSCs was similar to that of pancreas and islet tissues. MafA increased the expression levels of the mRNAs of NKx2.2, Glut2, insulin, glucagons and somatostatin, and further facilitated the differentiation of PDMSCs into insulin(+) cells. The glucose-stimulated responses to insulin and c-peptide production in MafA-overexpressing PDMSCs were significantly higher than in PDMSCs with vector control. Our results indicated that MafA-overexpressing PDMSCs were more resistant to oxidative damage and oxidative damage-induced apoptosis than PDMSCs carrying the vector control were. Importantly, the expression of MafA in PDMSCs xenotransplanted into immunocompromised mice improved the restoration of blood insulin levels to control values and greatly prolonged the survival of graft cells in immunocompromised mice with STZ-induced diabetes. In summary, these data suggest that MafA plays a novel role in the reprogramming of stem cells into pancreatic β-progenitors, promotes the islet-like characteristics of PDMSCs, as well as functionally enhances insulin production to restore the regulation of blood glucose levels in transplanted grafts.


Figures

Fig 1
Fig 1
Characterization of PDMSCs and two-step induction protocol. (A) The phenotypes of PDMSCs analyzed by flow cytometry (Positive: red line; blue colour: control). (B) Q-PCR analysis showing that PDMSCs express the mRNAs of Nanog, Nestin, Oct-4, Sox2, Sox17 and PDX1. (C) PDMSCs were transduced with a lentivirus carrying the MafA gene. The protein expression levels of MafA in vector control PDMSCs and MafA-overexpressing PDMSCs were verified by Western blotting. (D) Outline of the differentiation two-step protocol and stage-specific cell morphology. Essential factor manipulations at each stage are also shown. Data shown here are the mean ± S.D. of three independent experiments. *P < 0.001. Bar = 30 μm.
Fig 2
Fig 2
MafA promotes PDMSC reprogramming into pancreatic progenitors. (A) After 7 days of infection, gene expression microarray analysis (Gene tree) showing 500 altered genes differentially expressed in MafA-overexpressing PDMSCs compared to PDMSCs and adult MSCs by a hierarchy heat map (MSC: bone marrow-derived mesenchymal stem cell; EM: endometrium-derived mesenchymal stem cell). The time-dependent changes of the 500 altered genes are presented on a log scale of the expression values provided by the GeneSpring GX software. (B) Principal component analysis demonstrated that the gene signature of MafA–overexpressing PDMSCs was similar to that of islets tissues. (C) Average lineage distances between islet tissues and cell lines derived from PDMSC. (D) The mRNA expression levels of Sox17, FoxA2, PDX1 and MafA in vector control and MafA-overexpressing PDMSCs were detected by Q-RT-PCR. (E) The protein expression levels of MafA and PDX-1 in vector control PDMSCs and MafA-overexpressing PDMSCs were verified by Western blot. (F) By immunofluorescence staining, PDX-1 (green) was found to be highly expressed in the aggregated SB-MafA-overexpressing PDMSCs. Cell nuclei were stained with DAPI. Data shown here are the mean ± S.D. of three independent experiments. *P < 0.001. Bar = 50 μm.
Fig 3
Fig 3
MafA-overexpressing PDMSCs differentiate into insulin+ cells and enhance c-peptide release. After 7 days of culture in pancreatic induction medium, (A) quantitative real-time RT-PCR (Q-RT-PCR) and (B) Western blotting were performed to detect the expression levels of (Sox17, Foxa2, PDX1, NGN3 and MafA) mRNA and (PDX1, NGN3 and MafA) protein in the different groups. (C) After 7 days of induction, the mRNA levels of insulin, Glut2, Pax4, Nkx2.2, NeuroD, Isl-1, somatostatin and glucagon of different treated group were measured by Q-RT-PCR. (D) By immunofluorescence staining, insulin (red) and glucagon (green) were found to be highly expressed in the MafA-overexpressing PDMSCs (step 2) as compared other groups or control. *P < 0.001: PDMSC-MafA (MafA-overexpressing PDMSC; step 1) versus PDMSC-vector (control); #P < 0.001: PDMSC-MafA + induction (PDMSC-MafA treated with modified pancreatic selection medium; step 2) versus PDMSC-MafA (step 1). Data shown here are the mean ± S.D. of three independent experiments. Bar = 50 μm.
Fig 4
Fig 4
MafA increased c-peptide and insulin secretion in insulin+ cells. (A) Insulin release in response to physiological (5.5 mM) and high (25 mM) glucose concentrations from differentiated MafA-overexpressing PDMSCs (step 2) and control PDMSCs was measured after 7 days of pancreatic induction. (B) C-peptide release in response to glucose stimulation from differentiated MafA-overexpressing PDMSCs (step 2) and control PDMSCs was detected after 7 days of induction. (C) Immunofluorescence analysis was performed for the expression of insulin (green) and C-peptide (red) in differentiated MafA-overexpressing PDMSCs after 7 days of induction. Cell nuclei were stained with DAPI. Data shown here are the mean ± S.D. of three independent experiments. *P < 0.001 (25 mM group compared to 5.5 mM group). #P < 0.001: PDMSC-MafA (step 2) versus PDMSC-vector (control). Bar = 20 μm.
Fig 5
Fig 5
Insulin+, MafA-expressing PDMSCs resist oxidative-stress and IL-1β induced apoptosis. (A–C) Cells at the end of step 2 differentiation were treated with 150 μmol/l H2O2 with or without 25 mM glucose for 6 hrs, followed by MTT assay (A), annexin V staining (B) and the detection of intracellular ROS production (C). Cells were treated with 50 U/ml IL-1β or vehicle control for 18 hrs. Cell viability and apoptotic cells were determined by MTT assay (D) and annexin V staining (E), respectively. (F) Western blots showed the levels of Bcl-2, MnSOD, Bax and cleaved caspase 3 in cells receiving 50 U/ml IL-1β for 18 hrs. Data shown here are the mean ± S.D. of three independent experiments. *P < 0.001.
Fig 6
Fig 6
Roles of anti-oxidant effects of MafA in its cytoprotection of PDMSC. (A, B) After 7 days of pancreatic induction (step 2) of PDMSC with or without MafA overexpression, cells were treated with 50 U/ml IL-1β or vehicle control for 18 hrs, followed by detection of ROS production (A, fold of control) and GSH level (B, % of control). (C) After 7 days of pancreatic induction (step 2) of PDMSC with or without MafA overexpression, cells were pre-treated with or without 1 mmol/l BSO (a γ-glutamylcysteine synthetase inhibitor) and 0.5 mmol/l Tempol (a membrane-permeable radical scavenger) for 24 hrs, followed by treatment with 50 U/ml IL-1β or vehicle control. After another 18 hrs, cell survival (% of control) was determined. Data shown here are the mean ± S.D. of three independent experiments. *P < 0.001; ns: not significant (P > 0.05).
Fig 7
Fig 7
Xenotransplantation of differentiated MafA-overexpressing PDMSCs into STZ pre-treated SCID mice. (A) To effectively monitor the growth conditions of PDMSC xenotransplanted grafts in SCID mice, PDMSCs and MafA-overexpressing PDMSCs in vitro were transfected with GFP by lentivector, and further evaluated by in vitro GFP imaging (Upper-light morphology, Middle: GFP imaging; Bottom: Merged imaging) as well as in vivo GFP imaging (right part photograph). (B) A total of 2 × 10⁵ MafA-overexpressing PDMSCs-GFP or control PDMSCs-GFP were implanted into the subcapsular space of the left kidney (n= 6; each). After 4 weeks, ex vivo biopsies and histology revealed that transplanted MafA-overexpressing PDMSCs-GFP can grow solid tissues in the subrenal site but not in other organs (right part photograph; arrows: PDMSC-GFP xenograft). (C) The histological and immunofluorescent study for reviewing the characteristics of xenograft derived MafA-overexpressing PDMSCs (arrows: the islet-like clusters). (C) and (D) The immunofluorescent analysis revealed that the expression of insulin (red) and glucagon (green) in the graft was significantly higher in mice transplanted with MafA-overexpressing PDMSCs than in those with control PDMSCs. Data shown here are the mean ± S.D. of three independent experiments. *P < 0.05. Bar = 100 μm.
Fig 8
Fig 8
Restoration of normoglycaemia in STZ- pre-treated SCID mice through xenotransplantation of MafA-overexpressing PDMSCs. (A) The blood glucose levels of the group implanted with MafA-overexpressing PDMSCs (step 2) were significantly lower than those implanted with vector control PDMSCs and the STZ-control groups (P < 0.05). After the nephrectomy of transplanted grafts (arrow), the blood glucose levels were significantly increased in the transplanted MafA-overexpressing SCID mice (P < 0.05). (B) Serum human insulin detection 1 week after transplantation in STZ-induced diabetic mice. Random-fed blood glucose levels were measured in all groups. (C) Time-course changes of serum human insulin levels after transplantation (bottom). Data shown here are the mean ± S.D. of three independent experiments. *P < 0.05; **P < 0.001.

Similar articles

Cited by

References

    1. Ryan EA, Lakey JR, Paty BW, et al. Successful islet transplantation: continued insulin reserve provides long-term glycemic control. Diabetes. 2002;51:2148–57. - PubMed
    1. Robertson RP. Islet transplantation as a treatment for diabetes – a work in progress. N Engl J Med. 2004;350:694–705. - PubMed
    1. Matsuoka TA, Artner I, Henderson E, et al. The MafA transcription factor appears to be responsible for tissue-specific expression of insulin. Proc Natl Acad Sci USA. 2004;101:2930–3. - PMC - PubMed
    1. Kaneto H, Matsuoka TA, Kawashima S, et al. Role of MafA in pancreatic beta-cells. Adv Drug Deliv Rev. 2009;61:489–96. - PubMed
    1. Zhang C, Moriguchi T, Kajihara M, et al. MafA is a key regulator of glucose-stimulated insulin secretion. Mol Cell Biol. 2005;25:4969–76. - PMC - PubMed

Publication types

MeSH terms