

Statistics of protein-DNA binding and the total number of binding sites for a transcription factor in the mammalian genome
- PMID: 20158869
- PMCID: PMC2822526
- DOI: 10.1186/1471-2164-11-S1-S12
Statistics of protein-DNA binding and the total number of binding sites for a transcription factor in the mammalian genome
Abstract
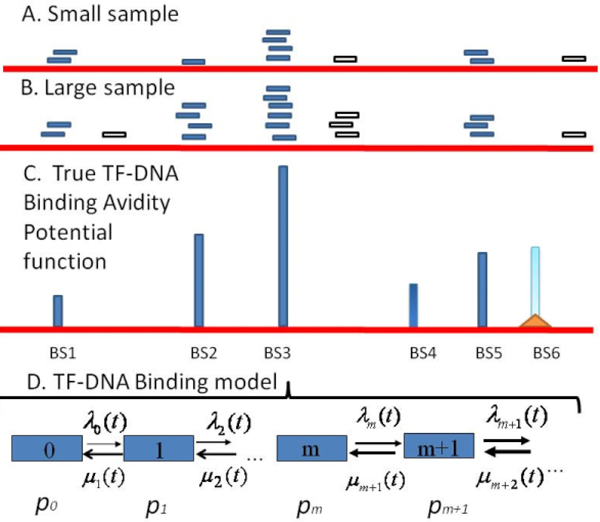
Background: Transcription factor (TF)-DNA binding loci are explored by analyzing massive datasets generated with application of Chromatin Immuno-Precipitation (ChIP)-based high-throughput sequencing technologies. These datasets suffer from a bias in the information about binding loci availability, sample incompleteness and diverse sources of technical and biological noises. Therefore adequate mathematical models of ChIP-based high-throughput assay(s) and statistical tools are required for a robust identification of specific and reliable TF binding sites (TFBS), a precise characterization of TFBS avidity distribution and a plausible estimation the total number of specific TFBS for a given TF in the genome for a given cell type.
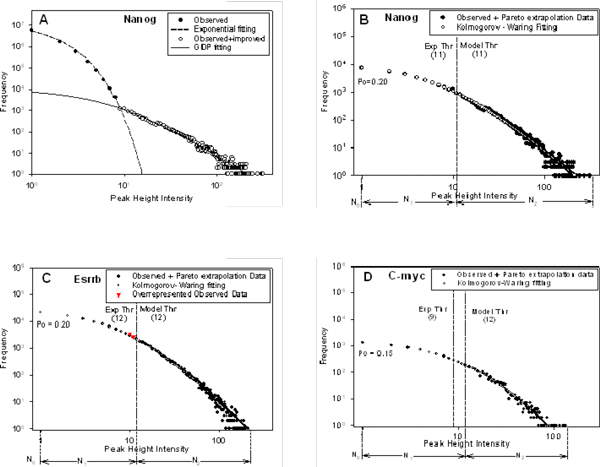
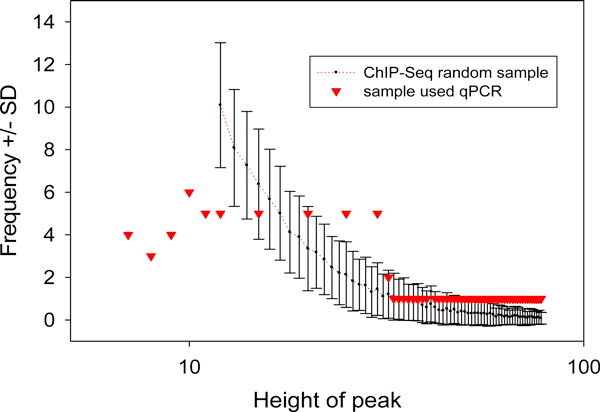
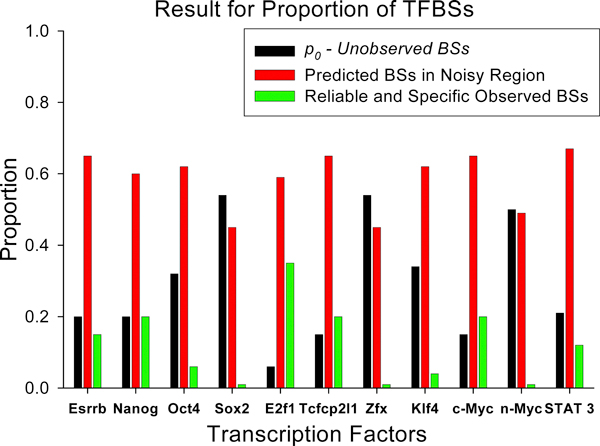
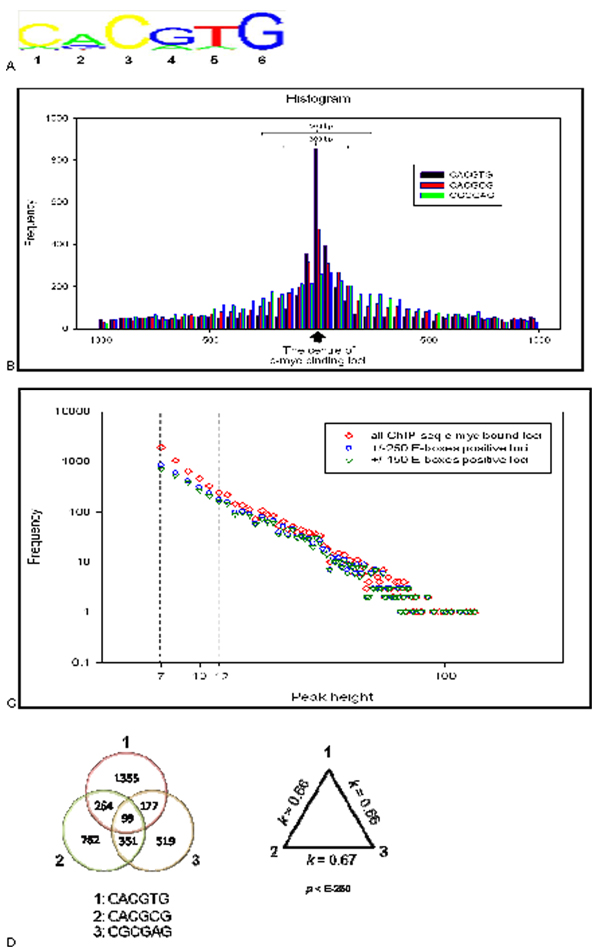
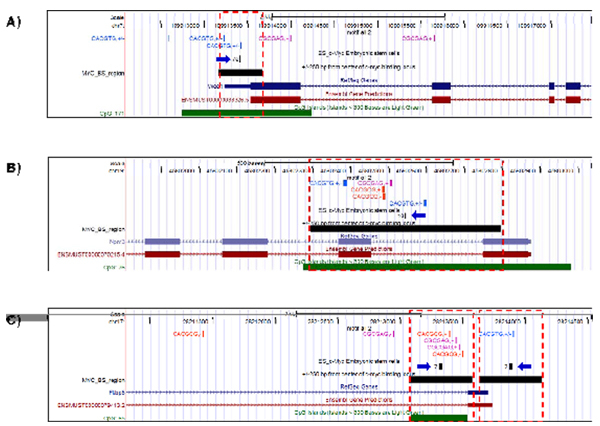
Results: We developed an exploratory mixture probabilistic model for a specific and non-specific transcription factor-DNA (TF-DNA) binding. Within ChiP-seq data sets, the statistics of specific and non-specific DNA-protein binding is defined by a mixture of sample size-dependent skewed functions described by Kolmogorov-Waring (K-W) function (Kuznetsov, 2003) and exponential function, respectively. Using available Chip-seq data for eleven TFs, essential for self-maintenance and differentiation of mouse embryonic stem cells (SC) (Nanog, Oct4, sox2, KLf4, STAT3, E2F1, Tcfcp211, ZFX, n-Myc, c-Myc and Essrb) reported in Chen et al (2008), we estimated (i) the specificity and the sensitivity of the ChiP-seq binding assays and (ii) the number of specific but not identified in the current experiments binding sites (BSs) in the genome of mouse embryonic stem cells. Motif finding analysis applied to the identified c-Myc TFBSs supports our results and allowed us to predict many novel c-Myc target genes.
Conclusion: We provide a novel methodology of estimating the specificity and the sensitivity of TF-DNA binding in massively paralleled ChIP sequencing (ChIP-seq) binding assay. Goodness-of fit analysis of K-W functions suggests that a large fraction of low- and moderate- avidity TFBSs cannot be identified by the ChIP-based methods. Thus the task to identify the binding sensitivity of a TF cannot be technically resolved yet by current ChIP-seq, compared to former experimental techniques. Considering our improvement in measuring the sensitivity and the specificity of the TFs obtained from the ChIP-seq data, the models of transcriptional regulatory networks in embryonic cells and other cell types derived from the given ChIp-seq data should be carefully revised.
Figures
Similar articles
-
Mathematical Modeling of Avidity Distribution and Estimating General Binding Properties of Transcription Factors from Genome-Wide Binding Profiles.Methods Mol Biol. 2017;1613:193-276. doi: 10.1007/978-1-4939-7027-8_9. Methods Mol Biol. 2017. PMID: 28849563
-
Relative avidity, specificity, and sensitivity of transcription factor-DNA binding in genome-scale experiments.Methods Mol Biol. 2009;563:15-50. doi: 10.1007/978-1-60761-175-2_2. Methods Mol Biol. 2009. PMID: 19597778
-
Improving analysis of transcription factor binding sites within ChIP-Seq data based on topological motif enrichment.BMC Genomics. 2014 Jun 13;15(1):472. doi: 10.1186/1471-2164-15-472. BMC Genomics. 2014. PMID: 24927817 Free PMC article.
-
An algorithmic perspective of de novo cis-regulatory motif finding based on ChIP-seq data.Brief Bioinform. 2018 Sep 28;19(5):1069-1081. doi: 10.1093/bib/bbx026. Brief Bioinform. 2018. PMID: 28334268 Review.
-
Role of ChIP-seq in the discovery of transcription factor binding sites, differential gene regulation mechanism, epigenetic marks and beyond.Cell Cycle. 2014;13(18):2847-52. doi: 10.4161/15384101.2014.949201. Cell Cycle. 2014. PMID: 25486472 Free PMC article. Review.
Cited by
-
MYCT1-TV, a novel MYCT1 transcript, is regulated by c-Myc and may participate in laryngeal carcinogenesis.PLoS One. 2011;6(10):e25648. doi: 10.1371/journal.pone.0025648. Epub 2011 Oct 5. PLoS One. 2011. PMID: 21998677 Free PMC article.
-
Multiple signatures of a disease in potential biomarker space: Getting the signatures consensus and identification of novel biomarkers.BMC Genomics. 2015;16 Suppl 7(Suppl 7):S2. doi: 10.1186/1471-2164-16-S7-S2. Epub 2015 Jun 11. BMC Genomics. 2015. PMID: 26100469 Free PMC article.
-
Quantitative model of R-loop forming structures reveals a novel level of RNA-DNA interactome complexity.Nucleic Acids Res. 2012 Jan;40(2):e16. doi: 10.1093/nar/gkr1075. Epub 2011 Nov 25. Nucleic Acids Res. 2012. PMID: 22121227 Free PMC article.
-
Role of IL-9 and STATs in hematological malignancies (Review).Oncol Lett. 2014 Mar;7(3):602-610. doi: 10.3892/ol.2013.1761. Epub 2013 Dec 16. Oncol Lett. 2014. PMID: 24520283 Free PMC article.
-
Promoter hypermethylation-induced transcriptional down-regulation of the gene MYCT1 in laryngeal squamous cell carcinoma.BMC Cancer. 2012 Jun 6;12:219. doi: 10.1186/1471-2407-12-219. BMC Cancer. 2012. PMID: 22672838 Free PMC article.
References
-
- Johnson DS, Mortazavi A, Myers RM, Wold B. Genome-wide mapping of in vivo protein-DNA interactions. Science (New York, NY) 2007;316(5830):1497–1502. - PubMed
Publication types
MeSH terms
Substances
LinkOut - more resources
Full Text Sources
Research Materials
Miscellaneous
