

Meta-Analysis
doi: 10.1186/1471-2164-11-S1-S8.
Bimodal gene expression patterns in breast cancer
Affiliations
- PMID: 20158879
- PMCID: PMC2822536
- DOI: 10.1186/1471-2164-11-S1-S8
Item in Clipboard
Meta-Analysis
Bimodal gene expression patterns in breast cancer
BMC Genomics.
.
Abstract
We identified a set of genes with an unexpected bimodal distribution among breast cancer patients in multiple studies. The property of bimodality seems to be common, as these genes were found on multiple microarray platforms and in studies with different end-points and patient cohorts. Bimodal genes tend to cluster into small groups of four to six genes with synchronised expression within the group (but not between the groups), which makes them good candidates for robust conditional descriptors. The groups tend to form concise network modules underlying their function in cancerogenesis of breast neoplasms.
Figures
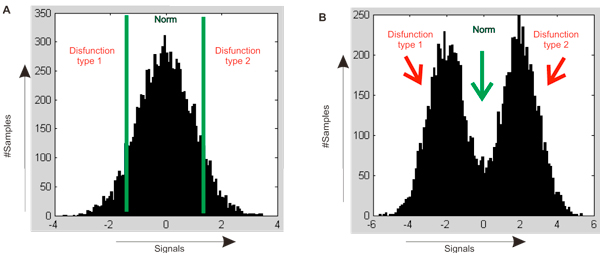
Signal distribution of normal and "bimodal" genes in patient cohort. (A) Theoretical normal gene signal distribution for quantitative traits [18]. (B) Theoretical bimodal gene signal distribution
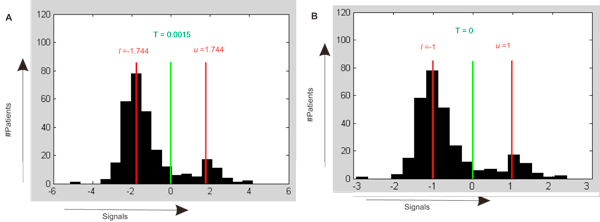
Bimodal genes. (A) Distribution of GRB7 expression among 295 patients (Sorlie295 dataset). The green line marks the threshold which separates the average of signals below threshold TGRB7≈0.0015. Red lines mark lGRB7≈1.74 and uGRB7≈1.77. (B) Distribution of GRB7 expression among 295 patients after normalization. The green line marks the threshold which separates the average of signals below threshold TGRB7 = 0. Red lines mark lGRB7≈-1 and uGRB7 = 1.
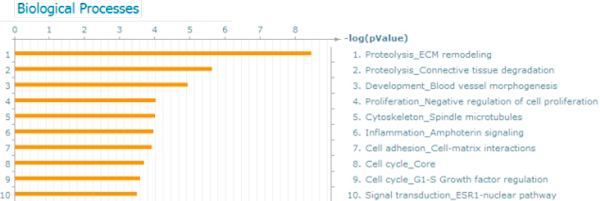
Ontology enrichment for the set of 866 bimodal genes.
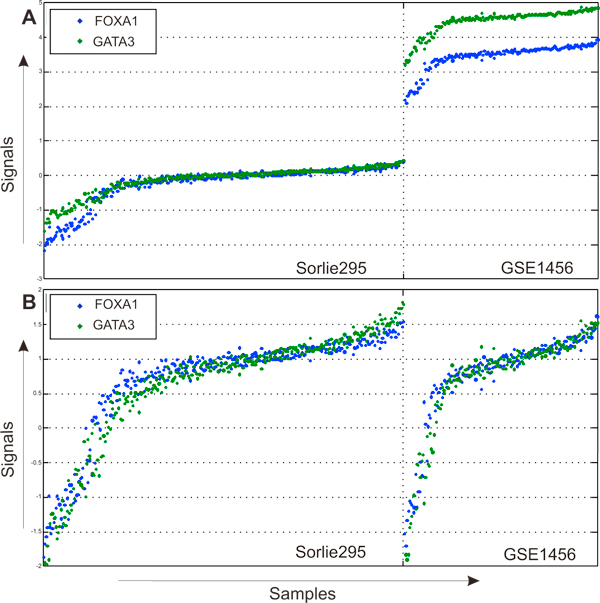
Signal normalization for bimodal genes. (A) Expression profiles for genes FOXA1 and GATA3 in Sorlie295 and GSE1456 data sets before normalization. (B) Expression profiles for genes FOXA1 and GATA3 in Sorlie295 and GSE1456 data sets before normalization and after normalization.
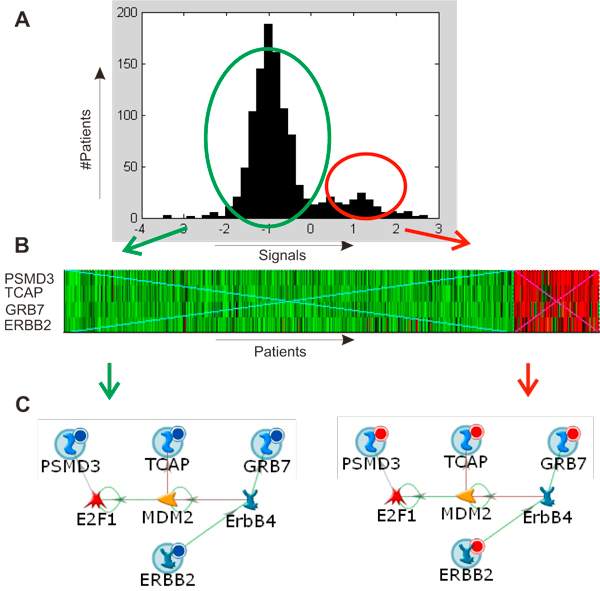
Identification of "Close neighbours" co-expression groups. (A) Average ERBB2 group expression profile. (B) Average ERBB2 group expression profile divides cohort of breast cancer patients into two groups. (C) "Close neighbours" expression group ERBB2 forms a network, functional module.
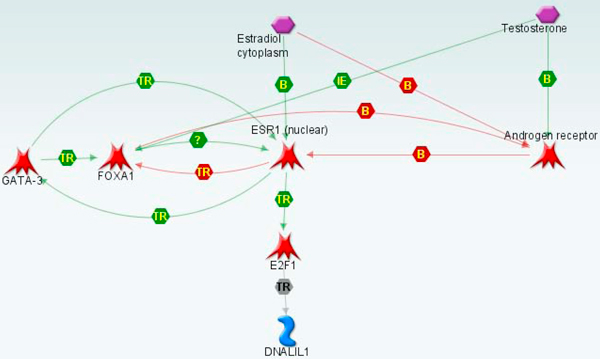
Co-expression of bimodal genes in ESR1 group. Genes from ESR1 group are regulated by an estradiol/testosterone regulation system
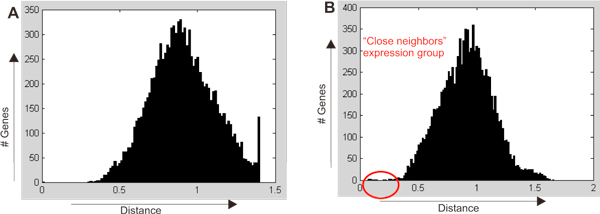
Identification of the "close" groups of genes in the space of 295 samples (Sorlie295 data set). (A) No close group is found for HMGA1 as query gene. OX: relative distances from the query gene to all 10604 array genes. OY: the number of genes. (B) Clear close group around ERBB2/GRB7 (encircled). OX: relative distances from the query gene to all 10604 array genes. OY: the number of genes.
Similar articles
-
Comparison of scores for bimodality of gene expression distributions and genome-wide evaluation of the prognostic relevance of high-scoring genes.BMC Bioinformatics. 2010 May 25;11:276. doi: 10.1186/1471-2105-11-276. BMC Bioinformatics. 2010. PMID: 20500820 Free PMC article.
-
MicroRNA expression and gene regulation drive breast cancer progression and metastasis in PyMT mice.Breast Cancer Res. 2016 Jul 22;18(1):75. doi: 10.1186/s13058-016-0735-z. Breast Cancer Res. 2016. PMID: 27449149 Free PMC article.
-
[Prognostic molecular classification of breast cancers based on gene expression profiling].Zhonghua Zhong Liu Za Zhi. 2006 Dec;28(12):900-6. Zhonghua Zhong Liu Za Zhi. 2006. PMID: 17533740 Chinese.
-
Identification of co-expression modules and potential biomarkers of breast cancer by WGCNA.Gene. 2020 Aug 5;750:144757. doi: 10.1016/j.gene.2020.144757. Epub 2020 May 6. Gene. 2020. PMID: 32387385
-
Gene expression profiling of breast cancer.Breast Cancer. 2006;13(1):2-7. doi: 10.2325/jbcs.13.2. Breast Cancer. 2006. PMID: 16518056 Review.
Cited by
-
Transcriptomic Biomarkers for Tuberculosis: Evaluation of DOCK9. EPHA4, and NPC2 mRNA Expression in Peripheral Blood.Front Microbiol. 2016 Oct 25;7:1586. doi: 10.3389/fmicb.2016.01586. eCollection 2016. Front Microbiol. 2016. PMID: 27826286 Free PMC article.
-
Switch-like gene expression modulates disease risk.Nat Commun. 2025 Jun 18;16(1):5323. doi: 10.1038/s41467-025-60513-x. Nat Commun. 2025. PMID: 40533442 Free PMC article.
-
Integrative DNA methylation and gene expression analysis in high-grade soft tissue sarcomas.Genome Biol. 2013 Dec 17;14(12):r137. doi: 10.1186/gb-2013-14-12-r137. Genome Biol. 2013. PMID: 24345474 Free PMC article.
-
On the role of extrinsic noise in microRNA-mediated bimodal gene expression.PLoS Comput Biol. 2018 Apr 17;14(4):e1006063. doi: 10.1371/journal.pcbi.1006063. eCollection 2018 Apr. PLoS Comput Biol. 2018. PMID: 29664903 Free PMC article.
-
RNAs competing for microRNAs mutually influence their fluctuations in a highly non-linear microRNA-dependent manner in single cells.Genome Biol. 2017 Feb 20;18(1):37. doi: 10.1186/s13059-017-1162-x. Genome Biol. 2017. PMID: 28219439 Free PMC article.
References
Publication types
MeSH terms
Grants and funding
LinkOut - more resources
Full Text Sources
Other Literature Sources
Medical
