

Dopamine release induced by atypical antipsychotics in prefrontal cortex requires 5-HT(1A) receptors but not 5-HT(2A) receptors
- PMID: 20158933
- PMCID: PMC6112770
- DOI: 10.1017/S146114571000009X
Dopamine release induced by atypical antipsychotics in prefrontal cortex requires 5-HT(1A) receptors but not 5-HT(2A) receptors
Abstract
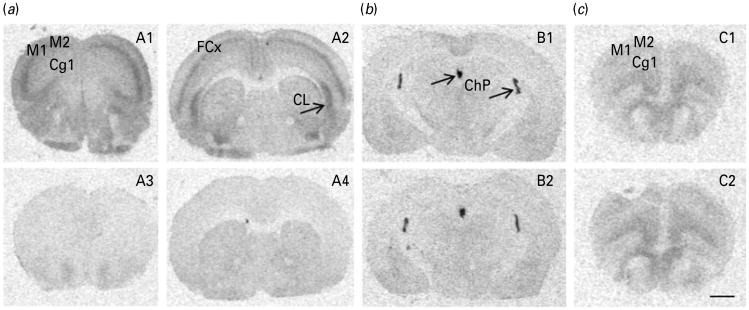
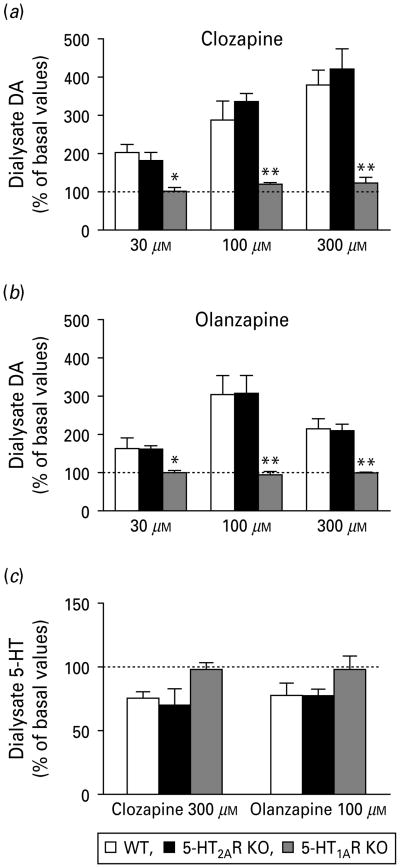
Atypical antipsychotic drugs (APDs) increase dopamine (DA) release in prefrontal cortex (PFC), an effect probably mediated by the direct or indirect activation of the 5-HT(1A) receptor (5-HT(1A)R). Given the very low in-vitro affinity of most APDs for 5-HT(1A)Rs and the large co-expression of 5-HT(1A)Rs and 5-HT(2A) receptors (5-HT(2A)Rs) in the PFC, this effect might result from the imbalance of 5-HT(1A)R and 5-HT(2A)R activation after blockade of these receptors by APDs, for which they show high affinity. Here we tested this hypothesis by examining the dependence of the APD-induced DA release in medial PFC (mPFC) on each receptor by using in-vivo microdialysis in wild-type (WT) and 5-HT(1A)R and 5-HT(2A)R knockout (KO) mice. Local APDs (clozapine, olanzapine, risperidone) administered by reverse dialysis induced a dose-dependent increase in mPFC DA output equally in WT and 5-HT(2A)R KO mice whereas the DA increase was absent in 5-HT(1A)R KO mice. To examine the relative contribution of both receptors to the clozapine-induced DA release in rat mPFC, we silenced G-protein-coupled receptors (GPCRs) in vivo with N-ethoxycarbonyl-2-ethoxy-1,2-dihydroquinoline (EEDQ) while 5-HT(1A)Rs or 5-HT(2A)/2CRs in the mPFC were selectively protected with the respective antagonists WAY-100635 or ritanserin. The inactivation of GPCRs while preserving ∼70% of 5-HT(2A)/(2C)Rs prevented the clozapine-induced DA rise in mPFC. In contrast, clozapine increased DA in mPFC of EEDQ-treated rats whose 5-HT(1A)Rs were protected (∼50% of control rats). These results indicate that (1) 5-HT(1A)Rs are necessary for the APDs-induced elevation in cortical DA transmission, and (2) this effect does not require 5-HT(2A)R blockade by APDs.
Figures


Similar articles
-
5-HT(2A) and D(2) receptor blockade increases cortical DA release via 5-HT(1A) receptor activation: a possible mechanism of atypical antipsychotic-induced cortical dopamine release.J Neurochem. 2001 Mar;76(5):1521-31. doi: 10.1046/j.1471-4159.2001.00154.x. J Neurochem. 2001. PMID: 11238736
-
5-HT(1A) and 5-HT(2A) receptors minimally contribute to clozapine-induced acetylcholine release in rat medial prefrontal cortex.Brain Res. 2002 Jun 7;939(1-2):34-42. doi: 10.1016/s0006-8993(02)02544-1. Brain Res. 2002. PMID: 12020849
-
ACP-103, a 5-HT2A/2C inverse agonist, potentiates haloperidol-induced dopamine release in rat medial prefrontal cortex and nucleus accumbens.Psychopharmacology (Berl). 2005 Dec;183(2):144-53. doi: 10.1007/s00213-005-0170-9. Epub 2005 Nov 9. Psychopharmacology (Berl). 2005. PMID: 16220333
-
Unraveling monoamine receptors involved in the action of typical and atypical antipsychotics on glutamatergic and serotonergic transmission in prefrontal cortex.Curr Pharm Des. 2010;16(5):502-15. doi: 10.2174/138161210790361416. Curr Pharm Des. 2010. PMID: 19909228 Review.
-
The role of serotonin receptors in the action of atypical antipsychotic drugs.Curr Opin Pharmacol. 2011 Feb;11(1):59-67. doi: 10.1016/j.coph.2011.02.007. Epub 2011 Mar 21. Curr Opin Pharmacol. 2011. PMID: 21420906 Review.
Cited by
-
Serotonin 5-HT1A receptors as targets for agents to treat psychiatric disorders: rationale and current status of research.CNS Drugs. 2013 Sep;27(9):703-16. doi: 10.1007/s40263-013-0071-0. CNS Drugs. 2013. PMID: 23757185 Review.
-
Residual dopamine receptor desensitization following either high- or low-dose sub-chronic prior exposure to the atypical anti-psychotic drug olanzapine.Psychopharmacology (Berl). 2013 Jan;225(1):141-50. doi: 10.1007/s00213-012-2802-1. Epub 2012 Jul 24. Psychopharmacology (Berl). 2013. PMID: 22825579
-
Neural basis for the ability of atypical antipsychotic drugs to improve cognition in schizophrenia.Front Behav Neurosci. 2013 Oct 16;7:140. doi: 10.3389/fnbeh.2013.00140. Front Behav Neurosci. 2013. PMID: 24137114 Free PMC article. Review.
-
Clozapine increases reward evaluation but not overall ingestive behaviour in rats licking for sucrose.Psychopharmacology (Berl). 2011 Aug;216(3):411-20. doi: 10.1007/s00213-011-2237-0. Epub 2011 Mar 1. Psychopharmacology (Berl). 2011. PMID: 21360098
-
Identifying the In Vivo Cellular Correlates of Antipsychotic Drugs.eNeuro. 2018 Dec 7;5(5):ENEURO.0220-18.2018. doi: 10.1523/ENEURO.0220-18.2018. eCollection 2018 Sep-Oct. eNeuro. 2018. PMID: 30713996 Free PMC article.
References
-
- Aghajanian GK, Marek GJ. Serotonin induces excitatory postsynaptic potentials in apical dendrites of neocortical pyramidal cells. Neuropharmacology. 1997;36:589–599. - PubMed
-
- Akil M, Pierri JN, Whitehead RE, Edgar CL, et al. Lamina-specific alterations in the dopamine innervation of the prefrontal cortex in schizophrenic subjects. American Journal of Psychiatry. 1999;156:1580–1589. - PubMed
-
- Amargós-Bosch M, Bortolozzi A, Adell A, Artigas F. Stimulation of α1-adrenoceptors in the rat medial prefrontal cortex increases the local in vivo 5-hydroxytryptamine release. Reversal by antipsychotics drugs. Journal of Neurochemistry. 2003;87:831–842. - PubMed
-
- Amargós-Bosch M, Bortolozzi A, Puig MV, Serrats J, et al. Co-expression and in vivo interaction of serotonin1A and serotonin2A receptors in pyramidal neurons of prefrontal cortex. Cerebral Cortex. 2004;14:281–299. - PubMed
-
- Araneda R, Andrade R. 5-Hydroxytryptamine-2 and 5-hydroxytryptamine1A receptors mediate opposing responses on membrane excitability in rat association cortex. Neuroscience. 1991;40:399–412. - PubMed
Publication types
MeSH terms
Substances
Grants and funding
LinkOut - more resources
Full Text Sources
Research Materials
Miscellaneous
