

Abnormal left and right amygdala-orbitofrontal cortical functional connectivity to emotional faces: state versus trait vulnerability markers of depression in bipolar disorder
- PMID: 20159144
- PMCID: PMC2835157
- DOI: 10.1016/j.biopsych.2009.11.025
Abnormal left and right amygdala-orbitofrontal cortical functional connectivity to emotional faces: state versus trait vulnerability markers of depression in bipolar disorder
Abstract
Background: Amygdala-orbitofrontal cortical (OFC) functional connectivity (FC) to emotional stimuli and relationships with white matter remain little examined in bipolar disorder individuals (BD).
Methods: Thirty-one BD (type I; n = 17 remitted; n = 14 depressed) and 24 age- and gender-ratio-matched healthy individuals (HC) viewed neutral, mild, and intense happy or sad emotional faces in two experiments. The FC was computed as linear and nonlinear dependence measures between amygdala and OFC time series. Effects of group, laterality, and emotion intensity upon amygdala-OFC FC and amygdala-OFC FC white matter fractional anisotropy (FA) relationships were examined.
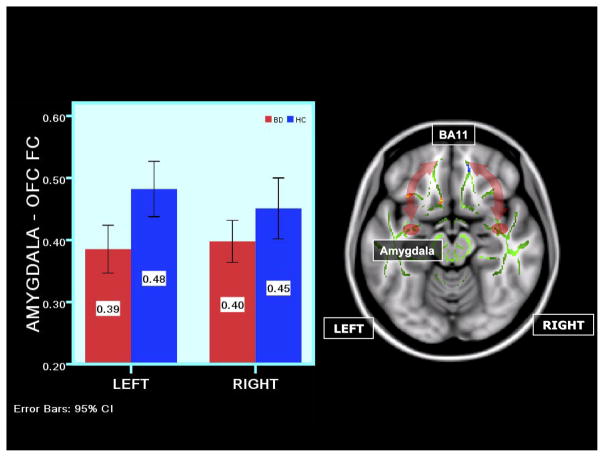
Results: The BD versus HC showed significantly greater right amygdala-OFC FC (p < or = .001) in the sad experiment and significantly reduced bilateral amygdala-OFC FC (p = .007) in the happy experiment. Depressed but not remitted female BD versus female HC showed significantly greater left amygdala-OFC FC (p = .001) to all faces in the sad experiment and reduced bilateral amygdala-OFC FC to intense happy faces (p = .01). There was a significant nonlinear relationship (p = .001) between left amygdala-OFC FC to sad faces and FA in HC. In BD, antidepressants were associated with significantly reduced left amygdala-OFC FC to mild sad faces (p = .001).
Conclusions: In BD, abnormally elevated right amygdala-OFC FC to sad stimuli might represent a trait vulnerability for depression, whereas abnormally elevated left amygdala-OFC FC to sad stimuli and abnormally reduced amygdala-OFC FC to intense happy stimuli might represent a depression state marker. Abnormal FC measures might normalize with antidepressant medications in BD. Nonlinear amygdala-OFC FC-FA relationships in BD and HC require further study.
Copyright 2010 Society of Biological Psychiatry. Published by Elsevier Inc. All rights reserved.
Conflict of interest statement
The authors reported no biomedical financial interests or potential conflicts of interest.
Figures


Similar articles
-
Amygdala activity and prefrontal cortex-amygdala effective connectivity to emerging emotional faces distinguish remitted and depressed mood states in bipolar disorder.Bipolar Disord. 2012 Mar;14(2):162-74. doi: 10.1111/j.1399-5618.2012.00999.x. Bipolar Disord. 2012. PMID: 22420592 Free PMC article.
-
Abnormal amygdala-prefrontal effective connectivity to happy faces differentiates bipolar from major depression.Biol Psychiatry. 2009 Sep 1;66(5):451-9. doi: 10.1016/j.biopsych.2009.03.024. Epub 2009 May 17. Biol Psychiatry. 2009. PMID: 19450794 Free PMC article.
-
Elevated amygdala activity to sad facial expressions: a state marker of bipolar but not unipolar depression.Biol Psychiatry. 2010 Mar 1;67(5):414-21. doi: 10.1016/j.biopsych.2009.09.027. Epub 2009 Nov 22. Biol Psychiatry. 2010. PMID: 19931855 Free PMC article.
-
Rethinking the Use of Neutral Faces as a Baseline in fMRI Neuroimaging Studies of Axis-I Psychiatric Disorders.J Neuroimaging. 2017 May;27(3):281-291. doi: 10.1111/jon.12403. Epub 2016 Nov 2. J Neuroimaging. 2017. PMID: 27805291 Review.
-
The neuropsychology of mood disorders.Curr Psychiatry Rep. 2006 Dec;8(6):458-63. doi: 10.1007/s11920-006-0051-x. Curr Psychiatry Rep. 2006. PMID: 17162825 Review.
Cited by
-
Corticolimbic functional connectivity in adolescents with bipolar disorder.PLoS One. 2012;7(11):e50177. doi: 10.1371/journal.pone.0050177. Epub 2012 Nov 21. PLoS One. 2012. PMID: 23185566 Free PMC article.
-
A resting-state functional MRI study on central control of storage: brain response provoked by strong desire to void.Int Urol Nephrol. 2015 Jun;47(6):927-35. doi: 10.1007/s11255-015-0978-0. Epub 2015 Apr 28. Int Urol Nephrol. 2015. PMID: 25917482
-
Elucidating neural network functional connectivity abnormalities in bipolar disorder: toward a harmonized methodological approach.Biol Psychiatry Cogn Neurosci Neuroimaging. 2016 May;1(3):288-298. doi: 10.1016/j.bpsc.2015.12.006. Biol Psychiatry Cogn Neurosci Neuroimaging. 2016. PMID: 27453953 Free PMC article.
-
Independent and collaborative contributions of the cerebral hemispheres to emotional processing.Front Hum Neurosci. 2014 Apr 22;8:230. doi: 10.3389/fnhum.2014.00230. eCollection 2014. Front Hum Neurosci. 2014. PMID: 24795597 Free PMC article. Review.
-
Co-altered functional networks and brain structure in unmedicated patients with bipolar and major depressive disorders.Brain Struct Funct. 2017 Dec;222(9):4051-4064. doi: 10.1007/s00429-017-1451-x. Epub 2017 Jun 9. Brain Struct Funct. 2017. PMID: 28600678 Free PMC article.
References
-
- Murray CJL, Lopez AD. Evidence-based health policy—lessons from the global burden of disease study. Science. 1996;274:740–743. - PubMed
-
- Goodwin FK, Jamison KR, Ghaemi SN. Manic-Depressive Illness: Bipolar Disorders and Recurrent Depression. New York: Oxford University Press; 2007.
-
- Robinson JL, Monkul ES, Tordesillas-Gutierrez D, Franklin C, Bearden CE, Fox PT, et al. Frontolimbic circuitry in euthymic bipolar disorder: Evidence for prefrontal hyperactivation. Psychiatry Res Neuroimaging. 2008;164:106–113. - PubMed
-
- Adolphs R, Tranel D. Impaired judgments of sadness but not happiness following bilateral amygdala damage. J Cogn Neurosci. 2004;16:453–462. - PubMed
