

Immune response modeling of interferon beta-pretreated influenza virus-infected human dendritic cells
- PMID: 20159146
- PMCID: PMC2820658
- DOI: 10.1016/j.bpj.2009.10.049
Immune response modeling of interferon beta-pretreated influenza virus-infected human dendritic cells
Abstract
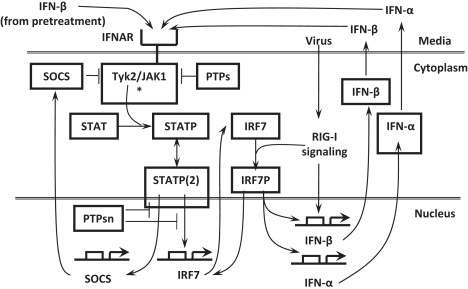
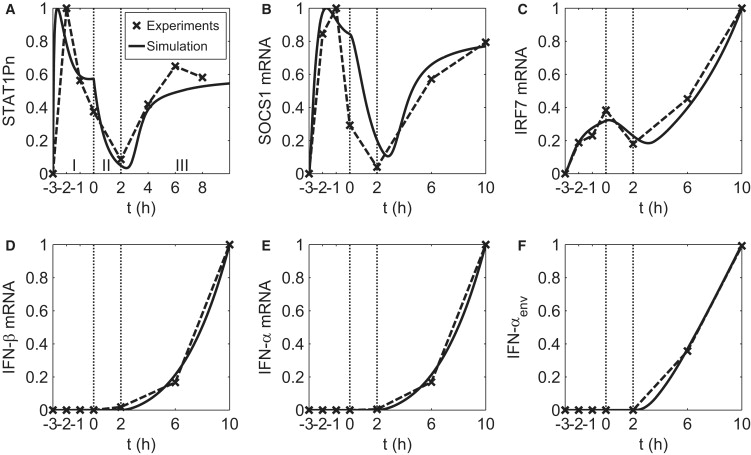
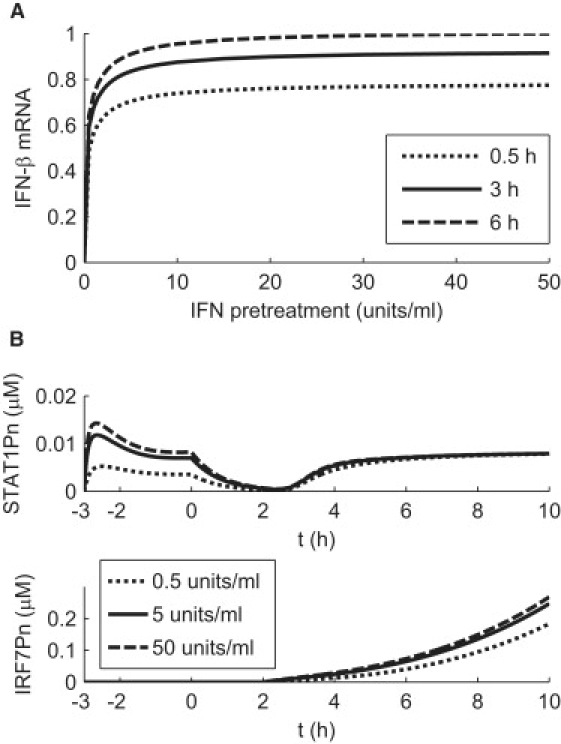
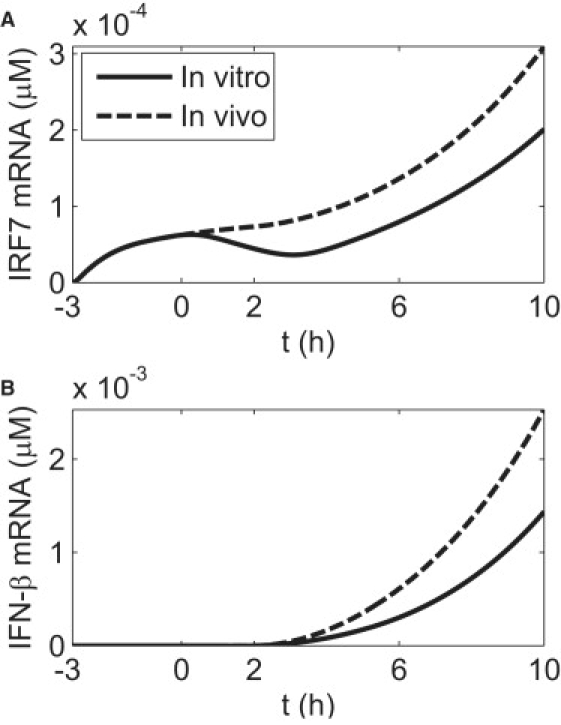
The pretreatment of human dendritic cells with interferon-beta enhances their immune response to influenza virus infection. We measured the expression levels of several key players in that response over a period of 13 h both during pretreatment and after viral infection. Their activation profiles reflect the presence of both negative and positive feedback loops in interferon induction and interferon signaling pathway. Based on these measurements, we have developed a comprehensive computational model of cellular immune response that elucidates its mechanism and its dynamics in interferon-pretreated dendritic cells, and provides insights into the effects of duration and strength of pretreatment.
Copyright 2010 Biophysical Society. Published by Elsevier Inc. All rights reserved.
Figures
Similar articles
-
Interferon-beta pretreatment of conventional and plasmacytoid human dendritic cells enhances their activation by influenza virus.PLoS Pathog. 2008 Oct;4(10):e1000193. doi: 10.1371/journal.ppat.1000193. Epub 2008 Oct 31. PLoS Pathog. 2008. PMID: 18974865 Free PMC article.
-
RLR-mediated production of interferon-β by a human dendritic cell subset and its role in virus-specific immunity.J Leukoc Biol. 2012 Jul;92(1):159-69. doi: 10.1189/jlb.0711360. Epub 2012 Apr 18. J Leukoc Biol. 2012. PMID: 22517920
-
Role of cell-to-cell variability in activating a positive feedback antiviral response in human dendritic cells.PLoS One. 2011 Feb 8;6(2):e16614. doi: 10.1371/journal.pone.0016614. PLoS One. 2011. PMID: 21347441 Free PMC article.
-
LTβR and CD40: working together in dendritic cells to optimize immune responses.Immunol Rev. 2011 Nov;244(1):85-98. doi: 10.1111/j.1600-065X.2011.01056.x. Immunol Rev. 2011. PMID: 22017433 Review.
-
Interferons alpha and beta as immune regulators--a new look.Immunity. 2001 Jun;14(6):661-4. doi: 10.1016/s1074-7613(01)00154-6. Immunity. 2001. PMID: 11420036 Review. No abstract available.
Cited by
-
Modeling and dynamical analysis of virus-triggered innate immune signaling pathways.PLoS One. 2012;7(10):e48114. doi: 10.1371/journal.pone.0048114. Epub 2012 Oct 30. PLoS One. 2012. PMID: 23118935 Free PMC article.
-
Kinetic Modeling of Virus Growth in Cells.Microbiol Mol Biol Rev. 2018 Mar 28;82(2):e00066-17. doi: 10.1128/MMBR.00066-17. Print 2018 Jun. Microbiol Mol Biol Rev. 2018. PMID: 29592895 Free PMC article. Review.
-
Multi-epitope Models Explain How Pre-existing Antibodies Affect the Generation of Broadly Protective Responses to Influenza.PLoS Pathog. 2016 Jun 23;12(6):e1005692. doi: 10.1371/journal.ppat.1005692. eCollection 2016 Jun. PLoS Pathog. 2016. PMID: 27336297 Free PMC article.
-
Novel Nipah virus immune-antagonism strategy revealed by experimental and computational study.J Virol. 2010 Nov;84(21):10965-73. doi: 10.1128/JVI.01335-10. Epub 2010 Aug 25. J Virol. 2010. PMID: 20739535 Free PMC article.
-
Model of influenza A virus infection: dynamics of viral antagonism and innate immune response.J Theor Biol. 2014 Jun 21;351:47-57. doi: 10.1016/j.jtbi.2014.02.029. Epub 2014 Mar 2. J Theor Biol. 2014. PMID: 24594370 Free PMC article.
References
-
- Banchereau J., Steinman R.M. Dendritic cells and the control of immunity. Nature. 1998;392:245–252. - PubMed
-
- Akira S., Takeda K. Toll-like receptor signalling. Nat. Rev. Immunol. 2004;4:499–511. - PubMed
-
- Takeuchi O., Akira S. MDA5/RIG-I and virus recognition. Curr. Opin. Immunol. 2008;20:17–22. - PubMed
Publication types
MeSH terms
Substances
Grants and funding
LinkOut - more resources
Full Text Sources
